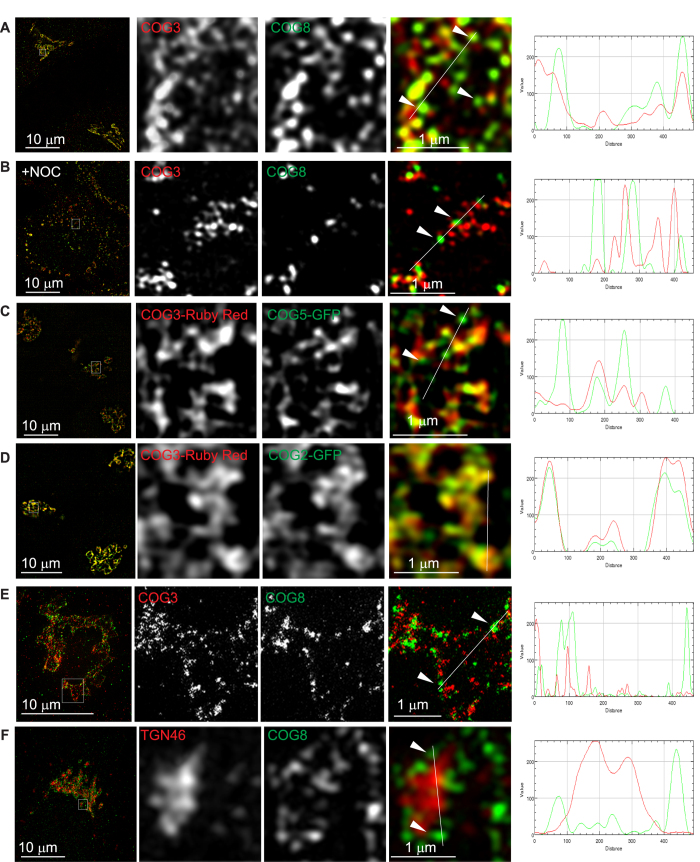
Figure 3. COG sub-complexes are spatially separated on Golgi membranes.
HeLa cells stained for endogenous COG3 and COG8 (A,B,E), TGN46 and COG8 (F) or co-express siRNA resistant COG3-Ruby Red and COG5-GFP (C) or siRNA resistant COG3-Ruby Red and COG2-GFP (D) were imaged using the Zeiss ELYRA S1 (SR-SIM) (A–D,F) or the Leica TCS SP8 STED 3x microscope (E). In (B) cells were pre-treated with nocodazole (10 mM). Using a gene replacement strategy, cells were depleted of COG2 (D), COG3 (C,D) or COG5 (C) using siRNA transfection. 72 h after knockdown cells were transfected with siRNA resistant COG3-Ruby Red (C,D), COG5-GFP (C) or COG2-GFP (D), 24 h later cells were fixed and analyzed. Endogenous COG3, COG3-Ruby Red (labeled in red) as well as COG2-GFP were shown in elongated tubule like structures, likely indicating Golgi membranes. Endogenous COG8 and COG5-GFP (labeled in green) demonstrated a different pattern and appeared in punctuate vesicle-like structures (arrowheads). Line plots for overlap between red and green channels are shown measuring the relative value of signal intensity (y-axis) over the distance measured in pixels (x-axis). The intensity line profile of the Golgi region imaged by 3D-SIM was generated using ImageJ. Bar, 10 μm (inset 1 μm).

