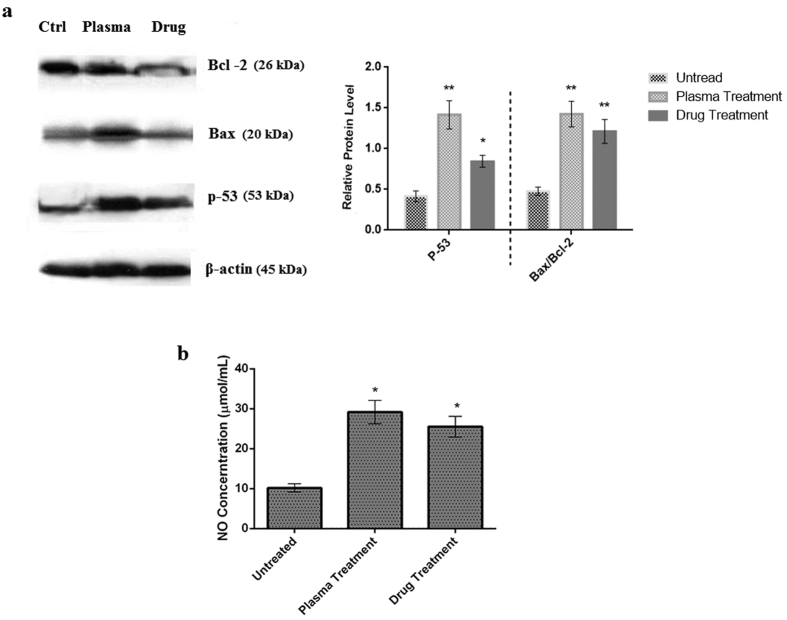
Figure 7.
(a) Western blot analysis to determine the expression of Bax and Bcl–2 in extracts from tumor cells in each treatment group. Ctrl: Untreated group, Plasma: Plasma treated group, Drug: Doxorubicin treated group. Compared to the control group (**P < 0.01 and *P < 0.05). (b) Nitric oxide concentration in the blood of the animals (*) compared to the control group (*P < 0.05).

