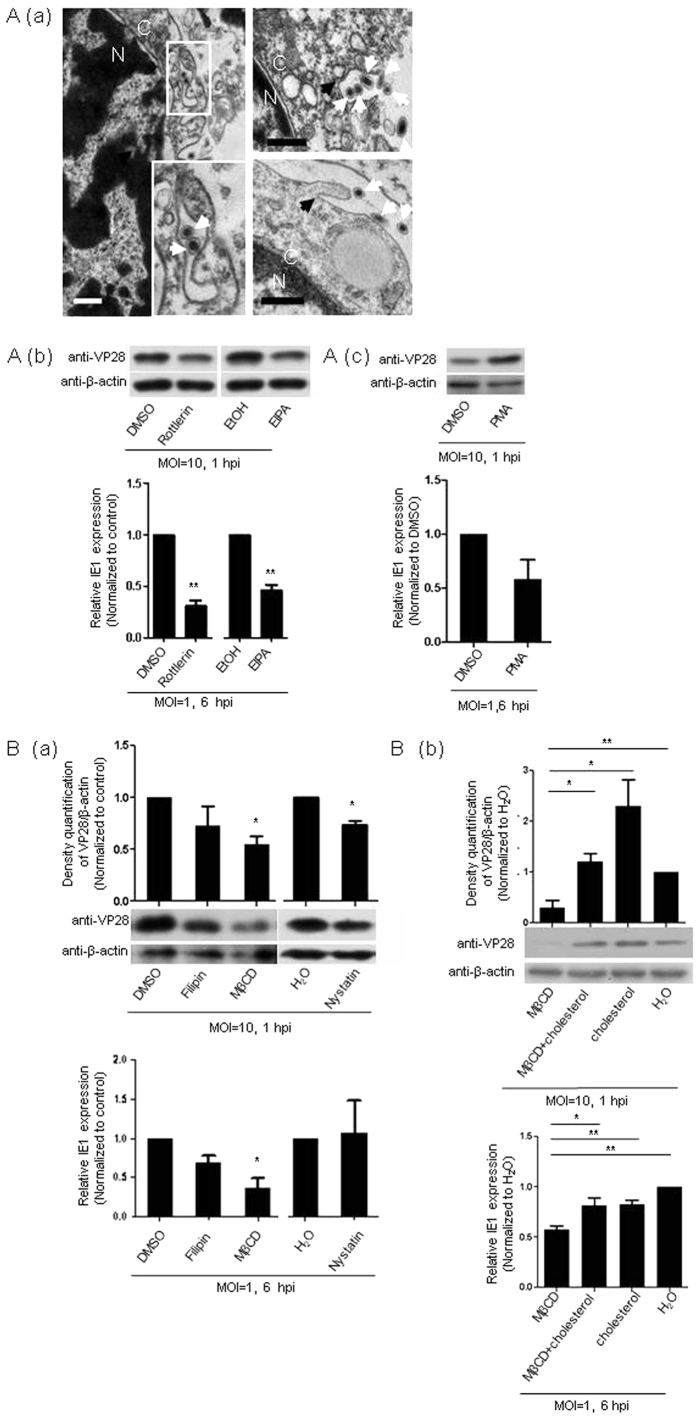
Figure 2. WSSV entry into Hpt cell via alternative endocytic routes.
(A) WSSV entry into Hpt cell via macropinocytosis. (a) WSSV virions captured by cell protrusions visualized by TEM. Black arrows indicate plasma membrane protrusions or macropinocytic cups, and white arrows indicate WSSV virions. The bars indicate 0.5 μm; C: cytoplasm; N: nucleus. (b) Inhibition of WSSV entry by pretreating the cells with the macropinocytosis inhibitors rottlerin and EIPA assessed by the relative quantification of the viral envelope protein VP28 at 1 hpi (upper panel). WSSV replication was determined by the relative quantification of IE1 gene expression using qRT-PCR at 6 hpi (lower panel). (c) Promotion of WSSV entry by pretreating the Hpt cell with the macropinocytosis inducer PMA determined by immunoblotting to quantify VP28 at 1 hpi (upper panel). WSSV replication was determined by the relative quantification of IE1 gene expression using qRT-PCR at 6 hpi (lower panel). (B) WSSV entry into Hpt cell via caveolae-mediated endocytosis. (a) Effect on WSSV entry induced by pretreating the cells with the caveolae-mediated endocytosis inhibitors filipin, MβCD or nystatin as determined by the relative quantification of the viral envelope protein VP28 via immunoblotting at 1 hpi. WSSV replication was determined by the relative quantification of IE1 gene expression using qRT-PCR at 6 hpi (lower panel) after pretreatment with filipin, MβCD or nystatin. (b) Rescue of WSSV entry achieved by cholesterol replenishment following inhibition by MβCD as determined by relative quantification of the viral envelope protein VP28 via immunoblotting at 1 hpi. Rescue of WSSV entry was achieved by cholesterol replenishment following inhibition by MβCD as determined by the relative quantification of IE1 gene expression using qRT-PCR at 6 hpi (lower panel). The band intensities of VP28 and β-actin from three independent experiments were analyzed using the Quantity One program (upper panel in B(a,b). All of the results were observed in at least three independent experiments, and one of the representative results is shown. The data are presented as the mean ± SEM from at least three independent experiments and were analyzed using Student’s t test (*P < 0.05, **P < 0.01).

