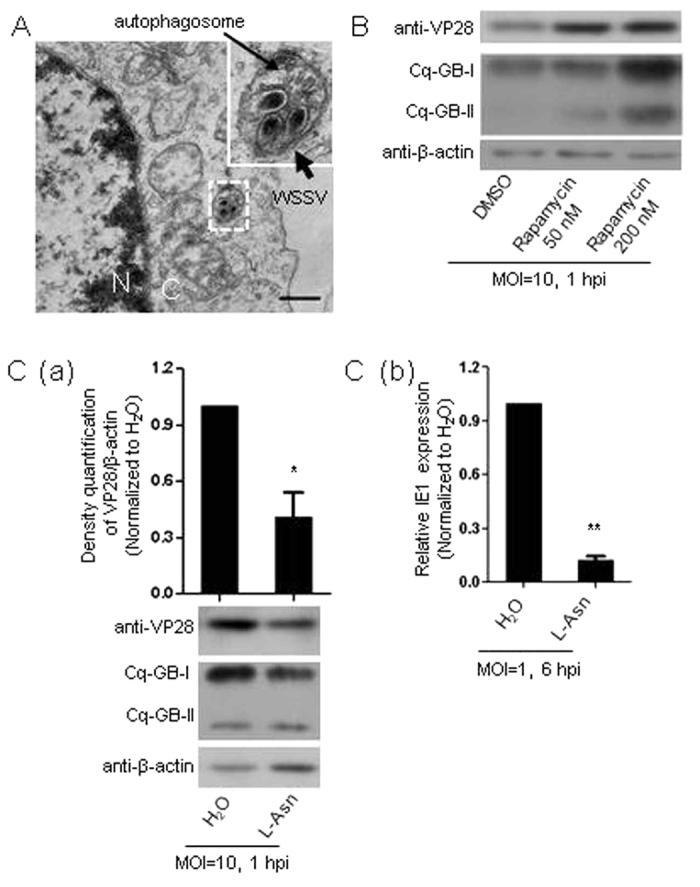
Figure 3. WSSV entry into Hpt cell was positively correlated with cellular autophagic activity.

(A) WSSV virions localized to autophagosomes visualized by TEM at the early stage of infection (0.5 hpi). The bar indicates 0.5 μm; C: cytoplasm; N: nucleus. (B) Increased WSSV entry with induction of autophagic activity by rapamycin. WSSV entry was determined by immunoblotting to quantify the viral envelope protein VP28 at 1 hpi. The induction of autophagy was monitored by detecting the conversion of Cq-GABARAP-I/Cq-GABARAP-II (i.e., Cq-GB-I/Cq-GB-II) with immunoblotting against Cq-GABARAP. (C) (a) Reduced WSSV entry and conversion of Cq-GB-I/Cq-GB-II by the autophagy inhibitor L-Asn determined by immunoblotting (lower panel). The band intensities of VP28 and β-actin from three independent experiments were analyzed using the Quantity One program (upper panel). (b) Reduced WSSV entry by L-Asn treatment determined by the relative quantification of IE1 gene expression using qRT-PCR at 6 hpi. All of the results were observed in at least three independent experiments, and one of the representative results is shown. The data are presented as the mean ± SEM from at least three independent experiments and were analyzed by Student’s t test (*P < 0.05, **P < 0.01).
