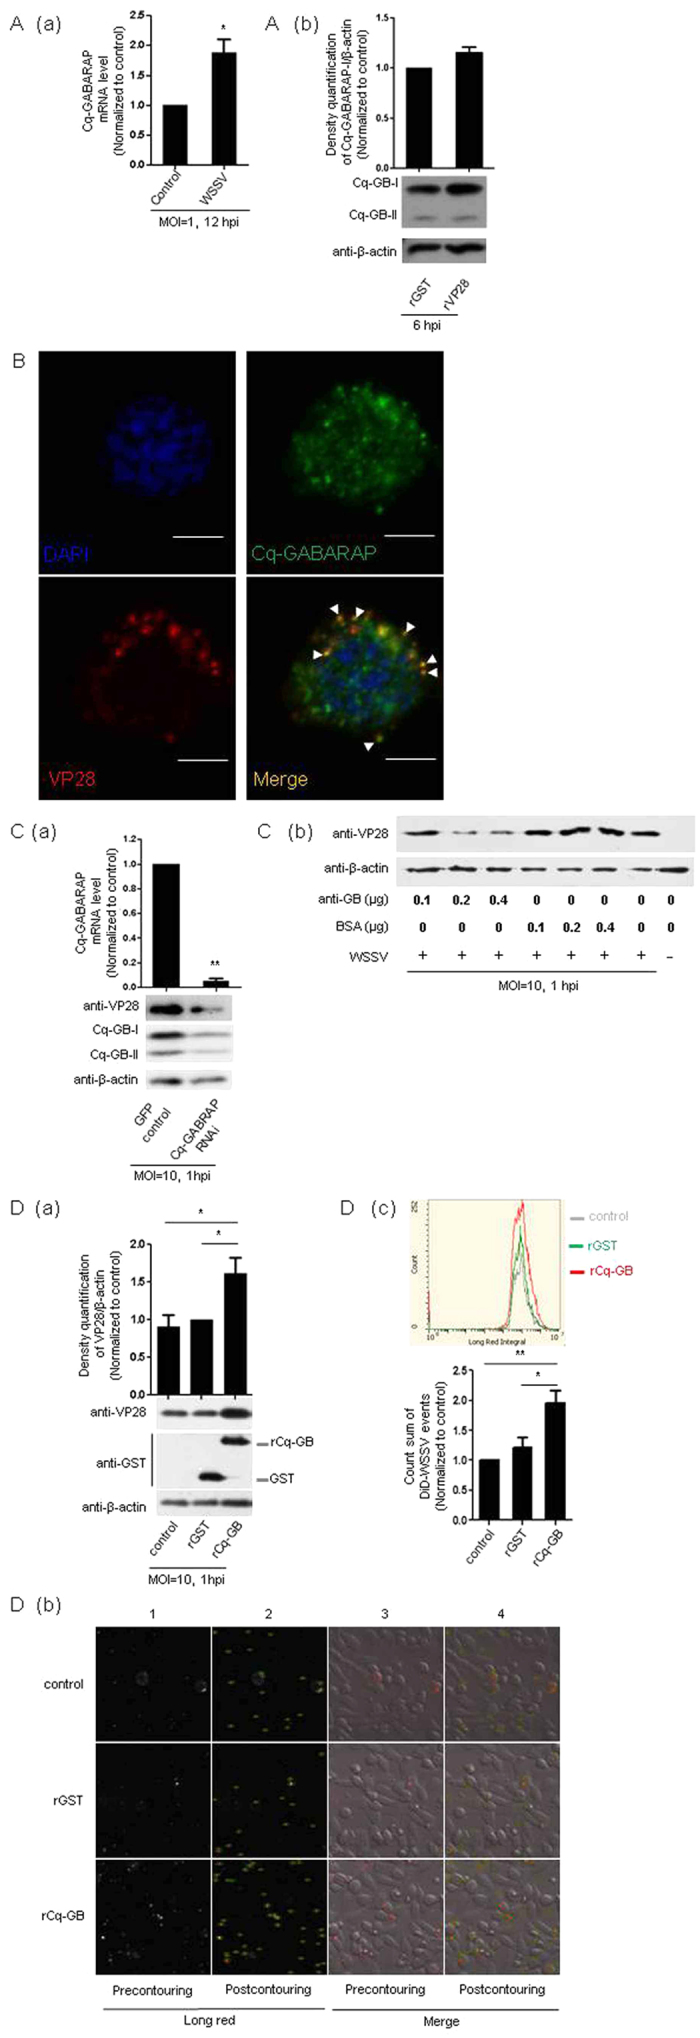
Figure 4. WSSV entry into Hpt cell promoted by rCq-GABARAP.

(A) Expression of the Cq-GABARAP gene (a) and protein (b) in response to WSSV infection or mock infection with recombinant viral VP28 (rVP28 with a GST tag) as examined by qRT-PCR and immunoblotting, respectively. (B) Co-localization of Cq-GABARAP with VP28 in Hpt cell at 3 hpi determined by dual-IFA with anti-GABARAP and anti-VP28 antibody. The nucleus was stained with DAPI. White arrowheads indicate the co-localizations of Cq-GABARAP with VP28. Bars, 5 μm. (C) Suppression of WSSV entry via loss-function-of Cq-GABARAP determined by immunoblotting. (a) The RNAi efficiency of Cq-GABARAP was examined by qRT-PCR (upper panel) (b) Hpt cells were transfected with an anti-GABARAP antibody using PULSin before viral infection. The same concentrations of BSA were used as control treatments accordingly. (D) WSSV entry promoted by rCq-GABARAP. (a) Enhanced WSSV entry was achieved after pre-incubation of the virus with 2 μg of rCq-GABARAP (rCq-GB) for 30 min determined by immunoblotting for VP28 at 1 hpi (lower panel). (b) Enhanced WSSV entry by rCq-GABARAP examined with a laser-scanning cytometer. DiD-labeled WSSV was incubated with 2 μg of rCq-GABARAP for 30 min and then inoculated into the Hpt cells. Images of the DiD-WSSV-infected cells were obtained using an iCys laser-scanning cytometer at 3 hpi. DiD-WSSV was automatically identified by the iCys software through proper contouring defined by the edge of the virion (green cycle) and pseudocolored with red in panel 3 and 4. (c) DiD-WSSV was identified by contouring (as indicated in panel 2 and 4 in (b)) with an iCys software and was then quantified (upper panel). The sum of DiD-WSSV counts shown in (b) was calculated (lower panel). The band intensities of three independent experiments were calculated using the Quantity One program (upper panel in A(b), D(a)). All of the results were observed in at least three independent experiments, and one of the representative results is shown. The data are presented as the mean ± SEM from at least three independent experiments and were analyzed by Student’s t test (*P < 0.05, **P < 0.01).
