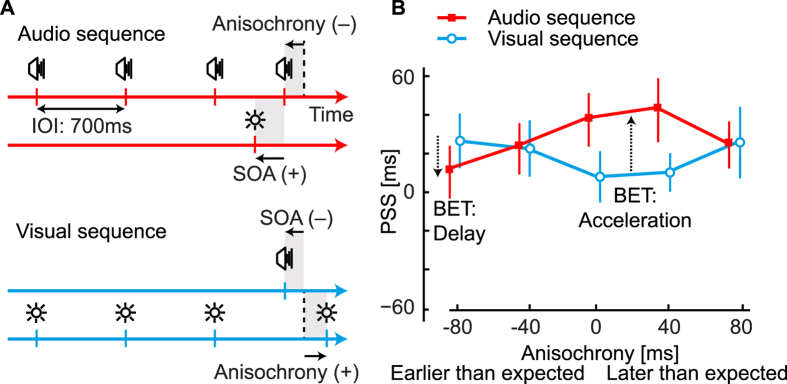
Figure 2. Stimuli and results of Experiment 2.
(A) Examples of trial sequences where participants judged the temporal order of the audiovisual pair presented at the end of a sequence. Auditory and visual sequences were interleaved. Top: An audio sequence with the final stimulus presented earlier than expected (negative anisochrony) and with a light presented before the final audio stimulus (positive SOA). Bottom: A visual sequence with the final stimulus presented later than expected (positive anisochrony) and with sound presented before the final visual stimulus (negative SOA). (B) Average PSS values corresponding to the SOA at which audio and visual stimuli are perceived as being simultaneous. On the y-axis, a positive PSS means that light has to be presented before the sound to be perceived as simultaneous, whilst a negative value means that the sounds has to be presented before the light to be perceived as synchronous. The difference between PSS values on the two curves indicates the bias by expected timing: in this graph perceptual acceleration happens when the audio PSS is higher than the visual PSS. If there was no change in perceived timing across the presented anisochronies, the pattern of PSS values should be horizontal. The BET, instead, changes as a function of anisochrony (interaction term of a two-way r.m. ANOVA, F(4, 44) = 4.8, p = 0.0026, ηp2 = 0.30) as stimuli presented at −80 ms are perceptually delayed whereas stimuli presented at 0 ms and +40 ms are perceptually accelerated.

