Figure 2.
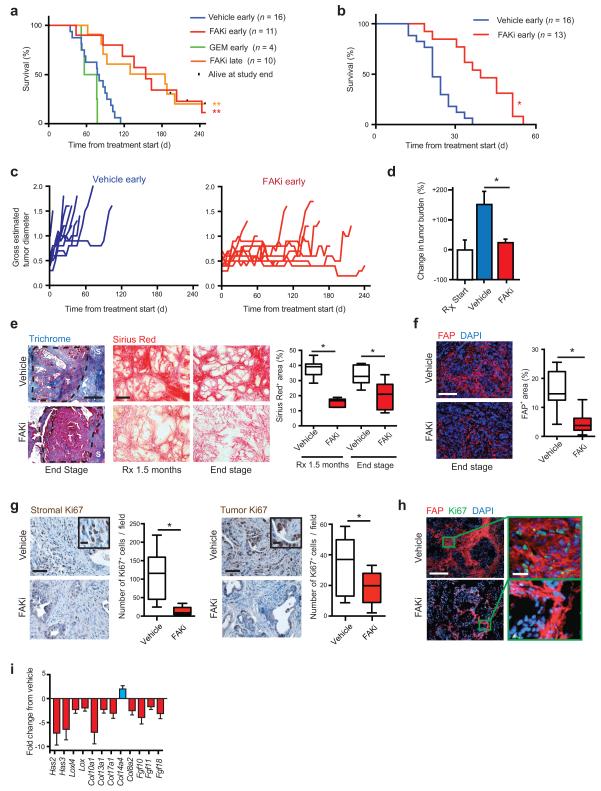
Inhibition of FAK reduces tumor fibrosis and suppresses tumor progression. (a, b) Kaplan-Meier survival analysis of (a) KPC and (b) KPPC mice treated with vehicle, FAK inhibitor (FAKi; VS-4718), or Gemcitabine (GEM). Treatment started at 3.5 months (“early”) or at overt disease (“late”) in a, and at 1.5 months in b. (c) Measurement of maximal tumor diameter in KPC mice since start of treatment as described in a. (d) Change in tumor burden in mice bearing established (> 0.5 cm) orthotopic KI tumors treated with vehicle or FAKi (n = 8–9 mice/group). (e) Representative Trichrome (Blue) and Sirius Red (Red) staining in PDAC tissue from KPC mice treated with either vehicle or FAKi; scale bars, 400 μm. Right panel depicts percentage of Sirius Red+ area for each treatment group and time point (n = 6–9 mice/group). (f) Representative immunofluorescence staining for FAP in PDAC tissue from vehicle- and FAKi- treated KPC mice; scale bar, 400 μm. Right panel depicts percentage of FAP+ area for each treatment group (n = 11–13 mice/group). (g) Representative immunohistochemistry and quantification for stromal and tumor Ki67+ cells from vehicle- and FAKi-treated KPC mice; scale bars, 200 μm (inset, 50 μm) (n = 8–11 mice/group). (h) Representative immunofluorescence staining for FAP and Ki67 in PDAC tissue from vehicle- and FAKi-treated KPC mice; scale bars, 400 μm (magnified field, 50 μm). (i) mRNA expression analysis from gene array of orthotopic KP tumors following 14-days treatment with vehicle or FAKi. (n = 6–7 mice/group). Error bars, mean ± s.e.m.; * indicates P < 0.05, ** indicates P < 0.01 by log-rank test (a,b), or unpaired two-sided Student’s t-test (d,e,f,g).

