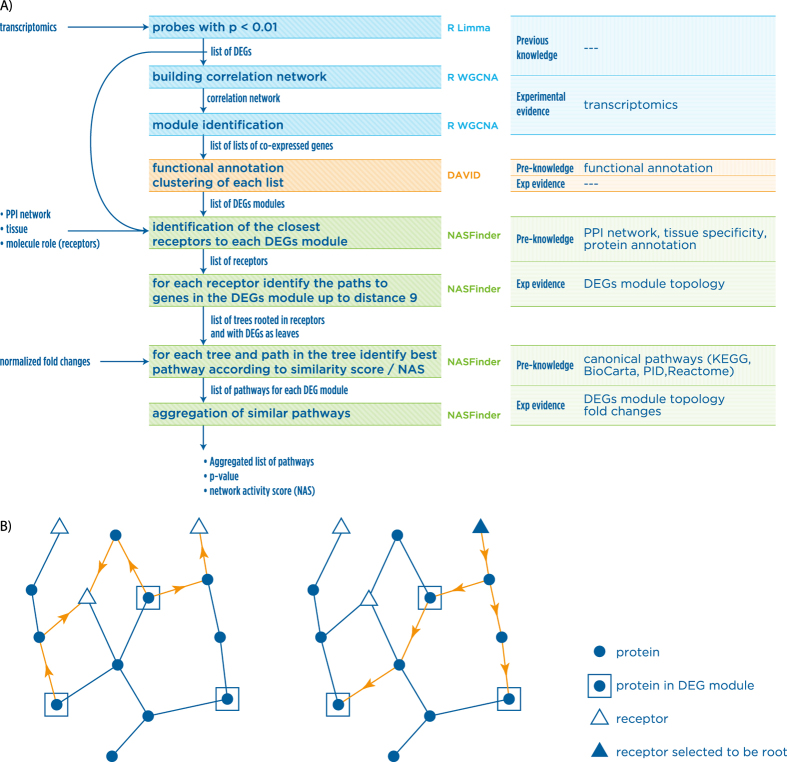
Figure 1.
(A) NASFinder pipeline. The input is a transcriptomic data set used to detect sets of genes that are differentially expressed and that have common biological functions (DEGs modules), a set of nodes of interest with specific functions (transporters, transcription factors, receptors, etc.), and a tissue-specific reference network to contextualize the gene sets for a better interpretation. The algorithm determines active sub-networks connecting receptors with DEGs modules and ranks them according to the network activity score. The significant sub-networks are then used for contextual enrichment analysis against canonical pathways. (B) Sub-network identification. The shortest paths from each element of the DEG module to the receptors are computed and the shortest ones are kept. In the figure the orange paths are the ones with minimal distance greater than 0 from the DEGs module to the regulator molecules (receptors in this study). In the next step (right graph) for each receptor previously selected (for instance, the top-right receptor in this case) we identify all the shortest paths from that receptor to the elements of the DEGs module (the orange paths).

