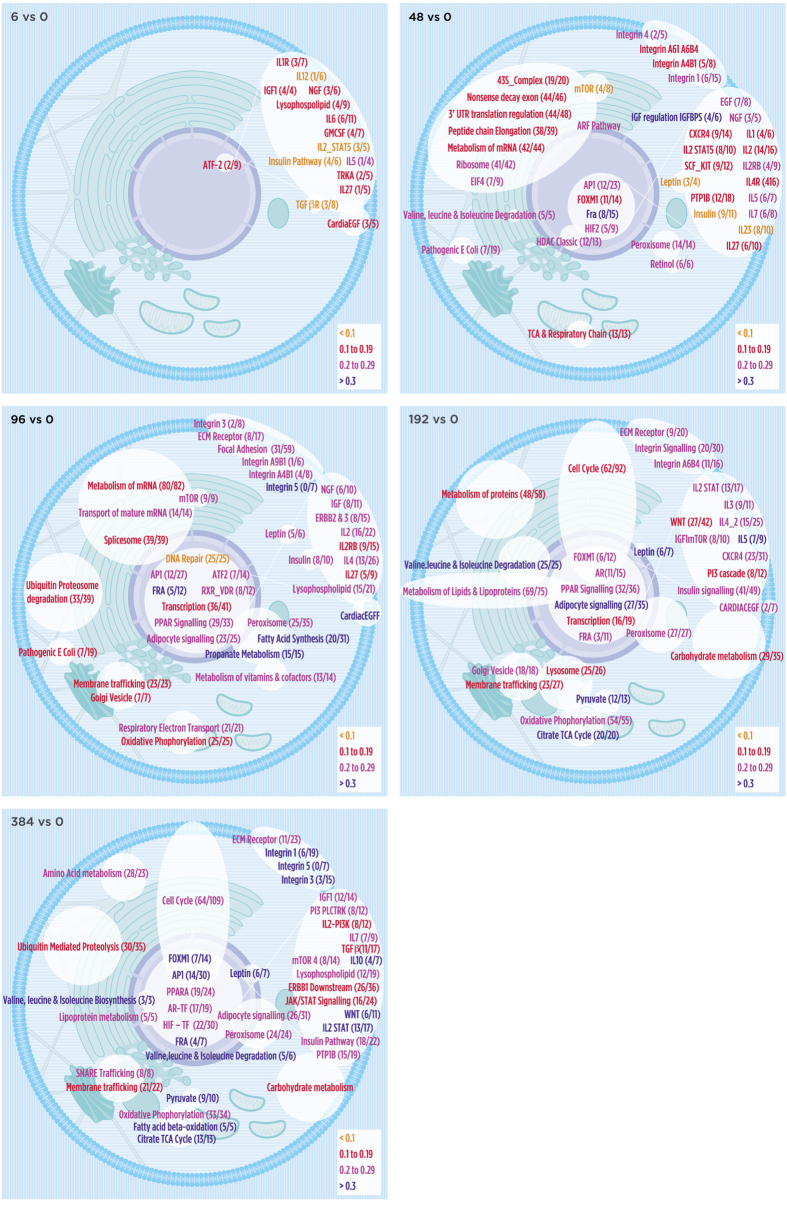
Figure 5. Selected pathways identified in the analyses are overlaid onto the cell based on the approximate location of the main cellular process of the genes involved and grouped by function.
Note that many pathways and networks overlap cellular compartments which could not be represented in this format. The white lines connecting the signaling pathways to the nuclear pathways are used to indicate that these networks have components from the cell membrane to transcriptional machinery. The colors represent the network activity score of up/down-regulated differentially expressed genes traversed in the active path and its 1-neighborhood context. That proportion is reported as a fraction in parenthesis (x/y) denoting the number of up-regulated genes with respect to the total traversed and contextual ones. TP analysis.

