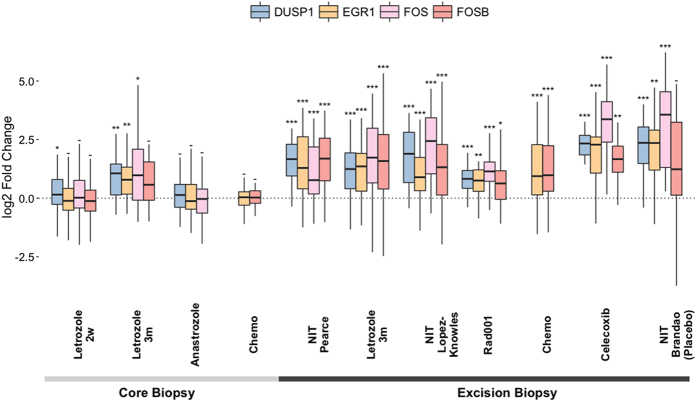
Figure 3. Multiple patient-matched datasets demonstrate shared changes in NIT early growth response genes.
Pairwise analysis of four early growth response genes among the NIT signature in six validation datasets. These genes potentially represent an association between gene expression and sampling method, with surgically excised samples (EB) showing greater expression fold-change than their core biopsied (CB) counterparts. *p ≤ 0.05; **p ≤ 0.01; ***p ≤ 0.001; − = not significant.

