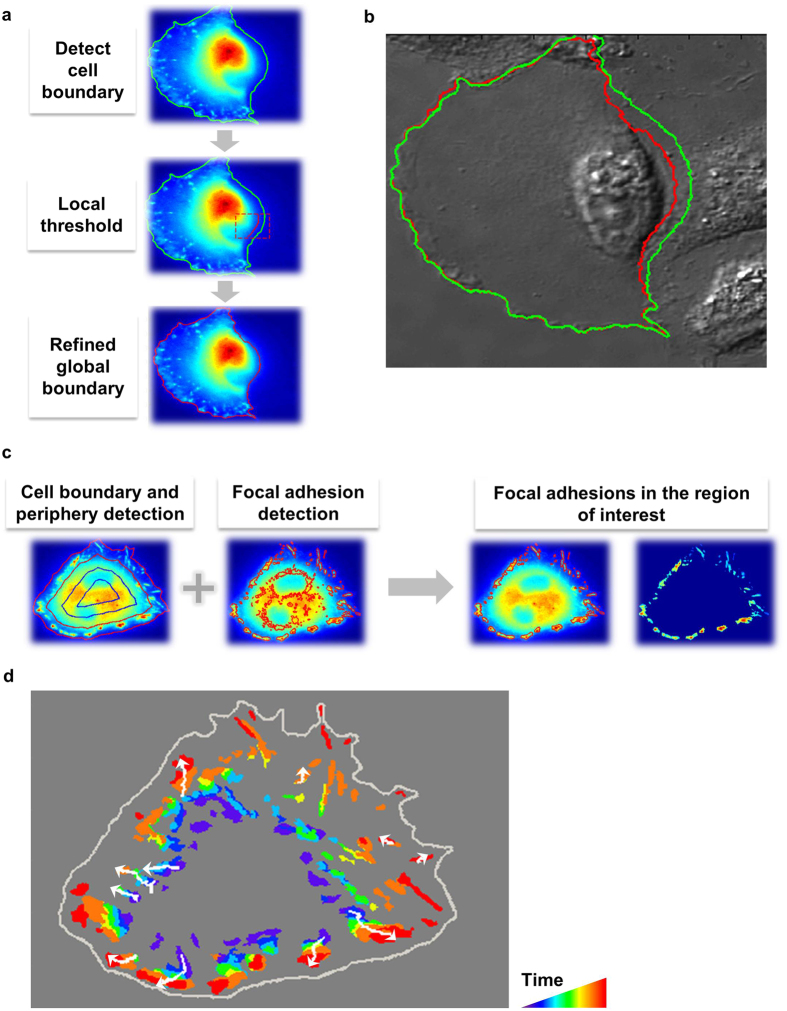
Figure 3. Cell and FA detection and tracking.
(a) Detection of the cell boundary and subsequent refinement using local threshold values. (b) Comparison of the detected cell boundaries before (green) and after (red) refinement on a DIC image. (c) The detection schematics of FAs at the cell periphery. (d) The trajectories (white) of the well-tracked individual FAs that did not merge or split in a representative cell. The rainbow colors represent FAs at different time points in chronological order, with violet representing the FAs from the earliest frame and red the latest. Arrows indicate the direction of the FA translocation during the adhesion process.

