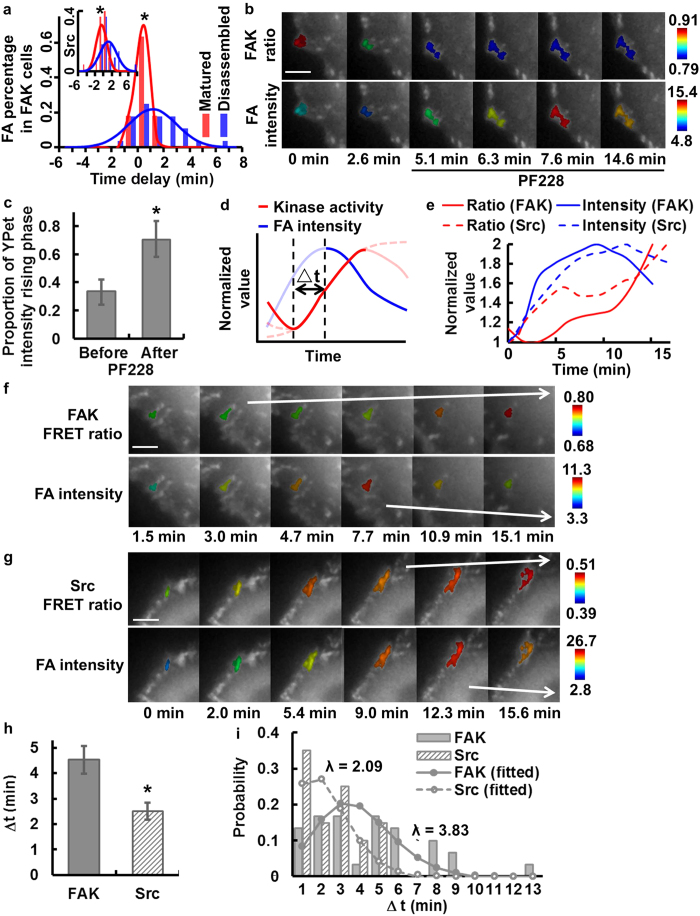
Figure 5. FAK activation leads Src activation and FA turnover sequentially.
(a) The histograms of the single-FA time delays between the rising YPet intensity and ECFP/FRET ratio in different FA groups with the FAT-FAK biosensor or FAT-Src biosensor (insert). * indicates significant difference of the mean time delays between the matured and disassembled groups (p < 0.05). (b) YPet intensity images of a cell before and after FAK inhibitor PF228 treatment, with a representative FA color-coded by its FAT-FAK ECFP/FRET ratio (top) or the total FA YPet intensity (bottom). (c) The portions of the YPet intensity rising phase in the periods before (34 ± 9%) and after (70 ± 13%) PF228 treatment in FAs (* indicates significant difference, p < 0.05; number of FAs: n = 10; number of cells: N = 1). (d) The schematic of the typical kinase activity and total FA intensity kinetics at an individual FA highlighting the FA disassembly phase (solid blue) and its associated kinase activation phase (solid red). The time delay, △t, is defined as the difference between the starting points of FA disassembly (solid blue curve) and its associated kinase activation phase (the immediate preceding local minimum in ECFP/FRET ratio). The lines in light colors illustrate the variations in ECFP/FRET ratio and YPet intensity trends among individual FAs. (e) The time courses of the ECFP/FRET ratio and YPet intensity in two representative FAs, each in cells with FAT-FAK (solid) or FAT-Src (dashed) biosensors. YPet intensity images of cells with the representative FAs in panel (e) color-coded by the ECFP/FRET ratio (top) or the total FA YPet intensity (bottom) in cells with either (f) FAT-FAK or (g) FAT-Src biosensors. (h) Compare the time delay, △t (4.5 ± 0.5 min and 2.5 ± 0.3 min, respectively), calculated at individual FAs as described in (d) *: statistically significant difference by Kolmogorov-Smirnov test (p < 0.05, n1 = 30 in 6 cells, n2 = 20 in 10 cells). (i) The fitted Poisson distribution of FAT-FAK △t (mean: λ = 3.66 min) and that of FAT-Src △t (mean: λ = 1.33 min). Error bar: SEM. Scale bar: 5 μm.

