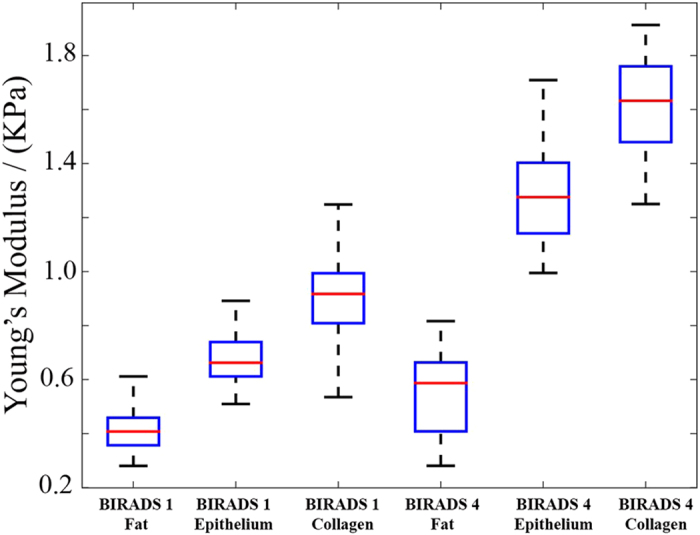
Figure 2. The distribution of indentation tests, profiled by AFM, is illustrated by box chart.

The chart shows the range of stiffness for fat, epithelium and collagen regions for low and high mammographic density, respectively. The red bar denotes the median value of the associate box.
