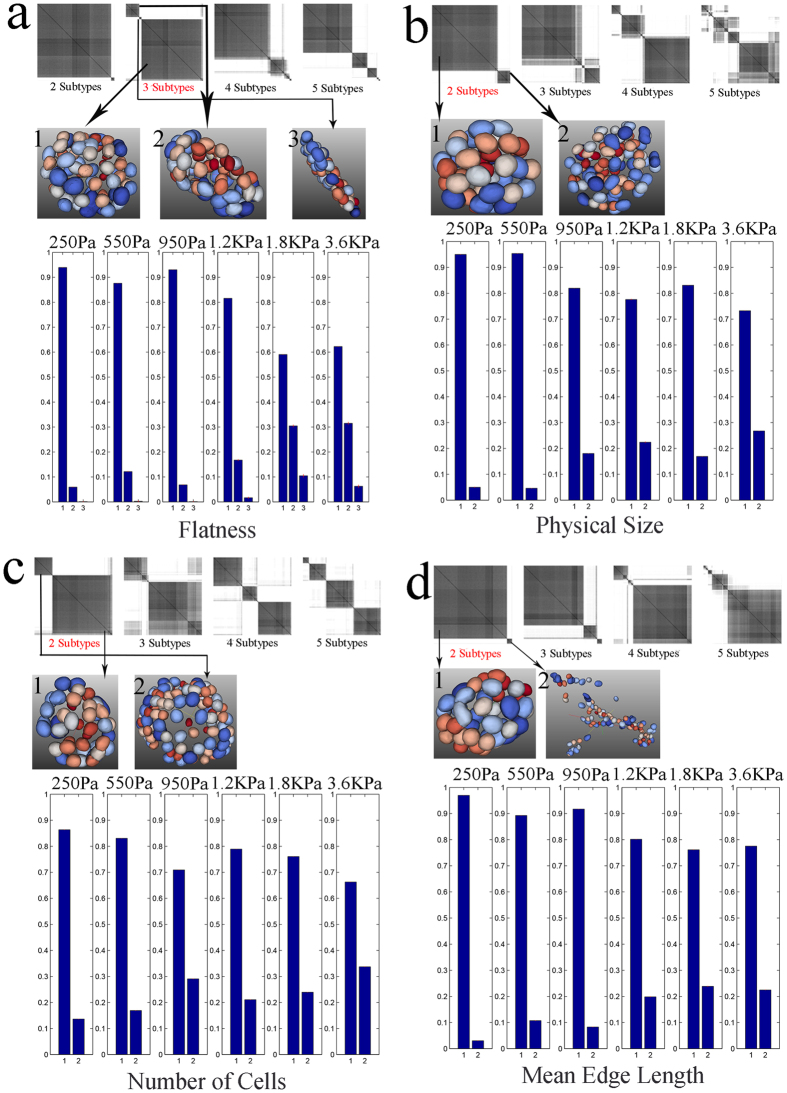
Figure 5.
Heterogeneity analysis, for MCF10A, through consensus clustering, identifies subtypes for a number of computed morphometric indices as a function of (a) colony flatness, (b) colony physical size, (c) number of nuclei per colony, and (d) mean edge length between adjacent nuclei within a colony. The representative phenotype of the 3D colony is shown for each subtype by segmenting and rendering nuclei in the colony.

