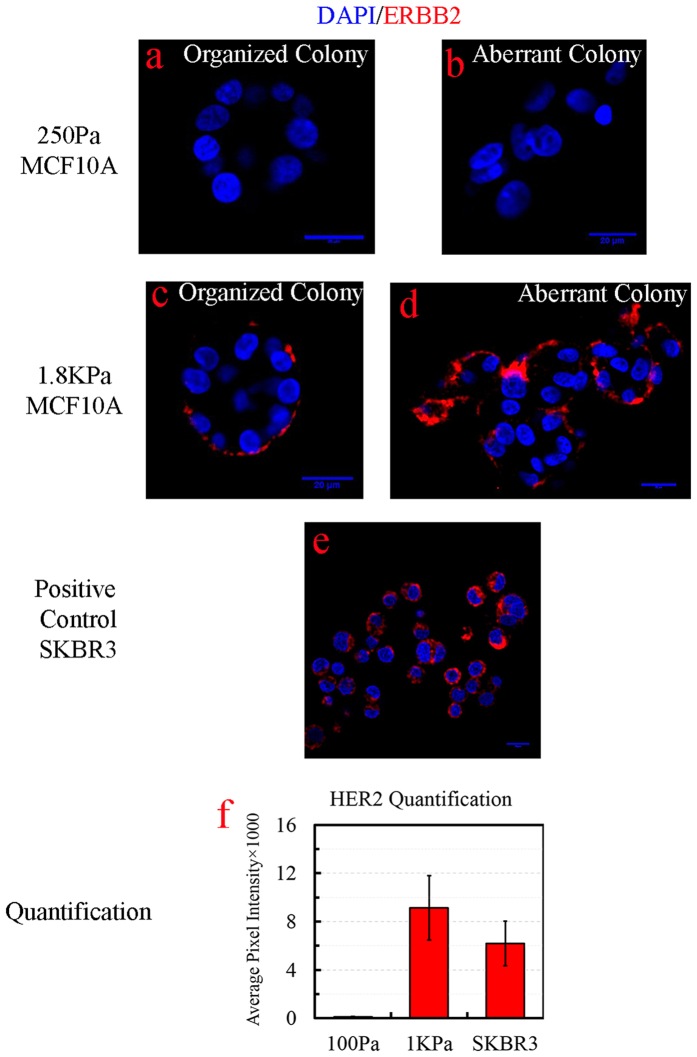
Figure 8. ERBB2 overexpression is imaged, by fluorescent microscopy, in a culture condition that mimic stiffness of the high MD for MCF10A.
(a,b) ERBB2 is not expressed at low stiffness of 250 Pa independent of colony organization. (c,d) ERBB2 is overexpressed at high stiffness of 1800 Pa independent of the colony organization. (e) Malignant line of SKBR3 overexpresses ERBB2 in 3D (positive control). (f) Quantitative analysis of ERBB2 expression for low and high stiffness with positive control as reference. The scale bar represents 20 μm.

