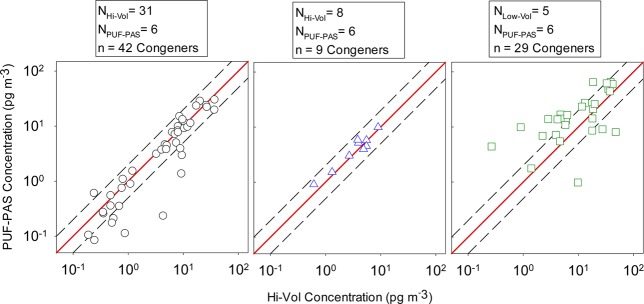
Figure 1.
PUF–PAS vs Hi-Vol comparison for select PCB congeners for Chicago, IL (left), Lancaster, UK (middle), and Toronto, Ontario (right). Both Hi-Vol and PUF–PAS values were taken as geometric means. The red line represents the 1:1 line and the dashed lines represent the 2:1 lines (i.e., factor of 2).

