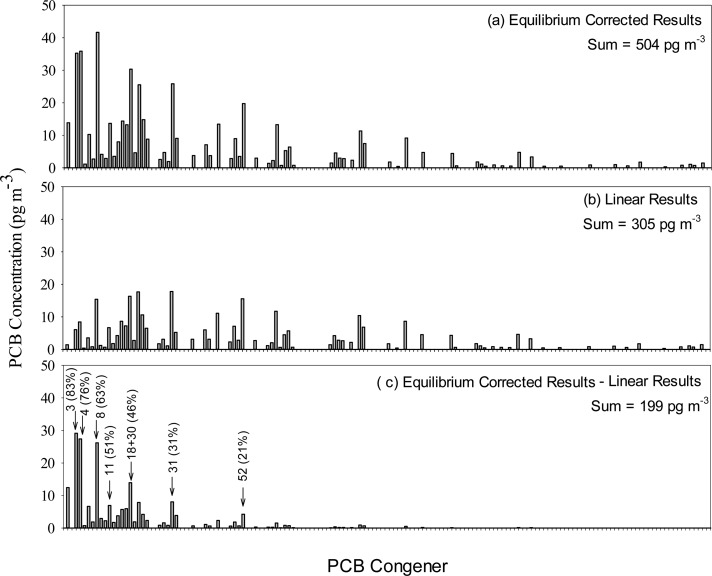
Figure 2.
Congener concentrations determined from a PUF–PAS sample (a) using the Veff calculated by this study, (b) using an assumption of linear uptake, (c) and the difference between the two results. The percentages in parentheses are the percent difference between equilibrium corrected and linear results.

