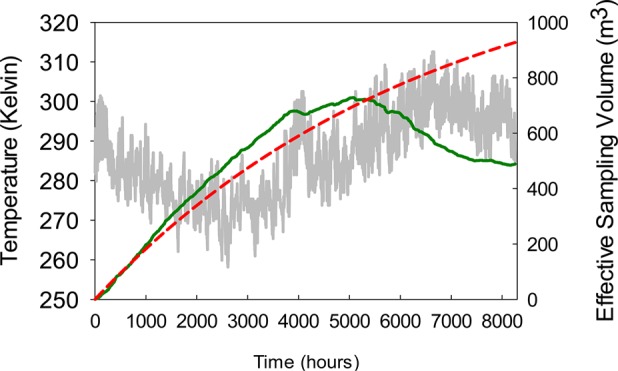
Figure 4.

Trend in Veff is plotted for a compound with a Koa of 108 that accumulated in a PUF–PAS sampler deployed in Chicago over an unusually long deployment period (344 days). The solid gray line represents the hourly air temperature. The solid green line represents the effective sampling volume calculated using the method of this study, including hourly adjustments on kv and KPUF. The dashed red line represents the effective sampling volume calculated without hourly adjustment of kv and KPUF..
