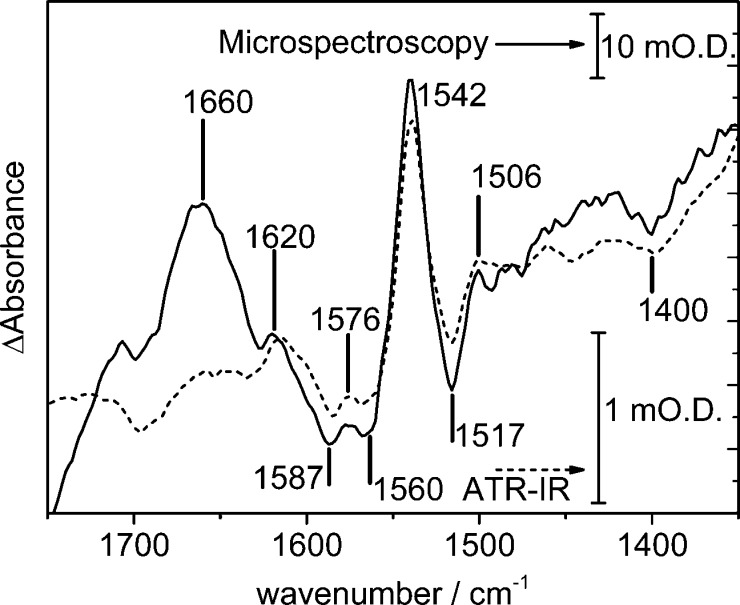
Figure 3.
Spectroelectrochemistry of FMN adsorbed on carbon black particles. Oxidized minus reduced difference spectra recorded in the ATR-IR (dashed) and reflection–absorption microspectroscopy (solid) cells. Difference spectra were calculated from spectra collected at +0.242 and −0.588 V as an average of 1024 interferograms. The spectrum recorded in the microspectroscopy cell was acquired from a 25 × 25 μm2 geometric area of the electrode, from spectra initiated at the times indicated with an ∗ in Figure 2. Potassium phosphate buffer, pH 6, containing 100 mM KCl was used as background electrolyte.

