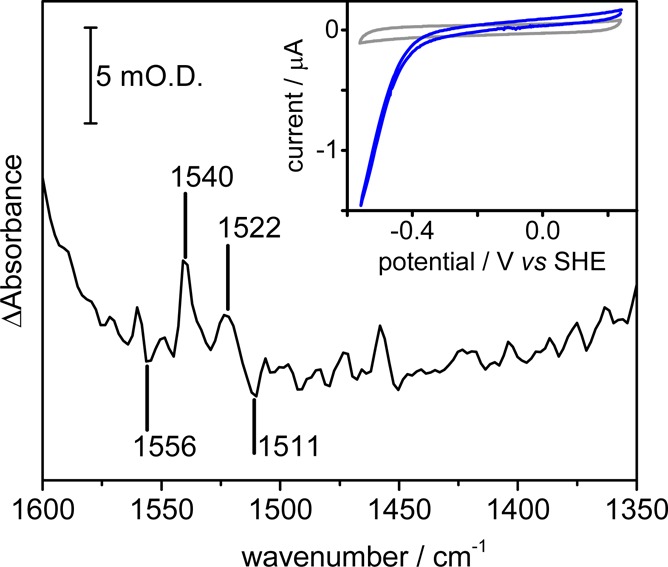
Figure 4.

Spectroelectrochemistry of NuoF cell-free extract adsorbed on carbon black particles. Oxidized minus reduced difference spectrum, recorded in the microspectroscopy cell, showing spectroscopic changes in the flavin region. The difference spectrum was calculated from spectra collected at +0.242 and −0.588 V as an average of 1024 interferograms. The inset shows a catalytic cyclic voltammogram (blue) of NuoF CE adsorbed on a pyrolytic graphite “edge” rotating disc electrode rotating at 2000 rpm in the presence of both NAD+ and NADH, compared to a cyclic voltammogram recorded in the absence of NuoF CE (gray). Potassium phosphate buffer, pH 6, containing 100 mM KCl was used as background electrolyte.
