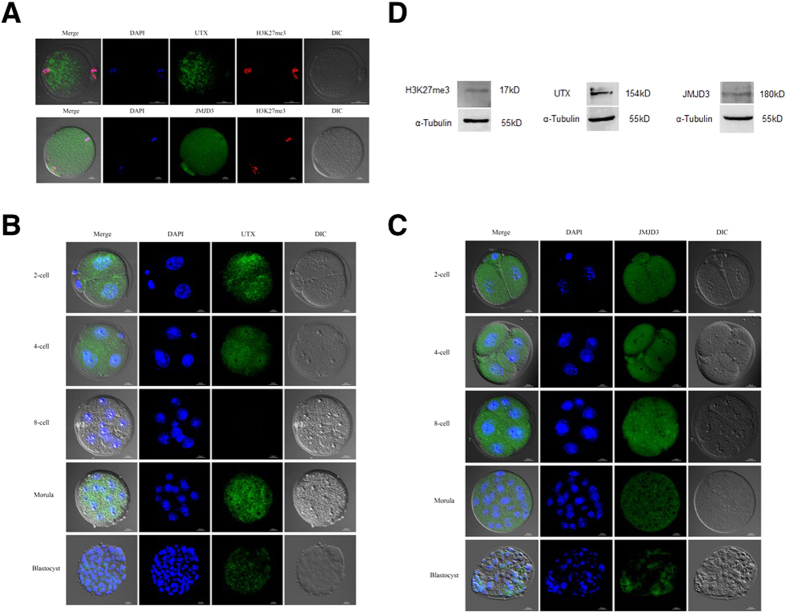
Figure 3. Subcellular distribution of UTX and JMJD3 in parthenogenetically activated preimplantation embryos.
(A) Immunostaining of UTX and JMJD3 in MII oocytes. Upper panel, scale bar, 50 μm. Lower panel, scale bar, 20 μm. Immunofluorescence staining using anti-UTX (B) and anti-JMJD3 (C) antibodies at the 2-cell, 4-cell, 8-cell, morula, and blastocyst stages. Scale bar, 20 μm. (D) Immunoblot of MII oocytes with UTX, JMJD3 and H3K27me3 antibodies.

