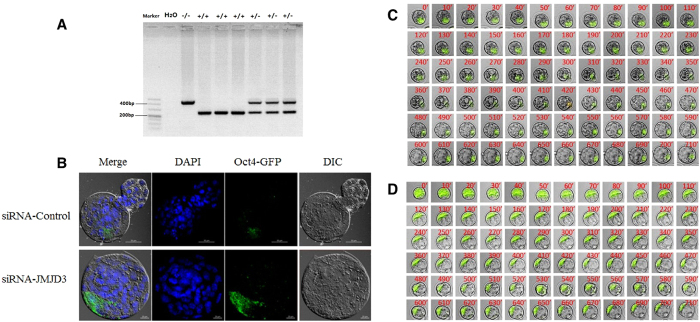
Figure 6. Knockdown of JMJD3 promoted blastocyst expression of Oct4-GFP.
(A) PCR analysis of the Oct4-GFP allele. Genomic DNA was amplified with primers detecting the wild-type allele (upper panel) and primers spanning the Oct4-GFP region (lower panel). (B) Detection of Oct4-GFP expression in blastocysts, injected siRNA-JMJD3 or siRNA-control. Upper panel, scale bar, 50 μm. Lower panel, scale bar, 20 μm. Typical time-lapse images of Oct4 promoter-driven GFP dynamics during preimplantation development. Representative images of siRNA-control (C) and siRNA-JMJD3 (D) injected embryos. Selected images are shown at 10-min intervals from an acquired series. The time at which the observations were started was the morula stage. Original magnification, × 200.

