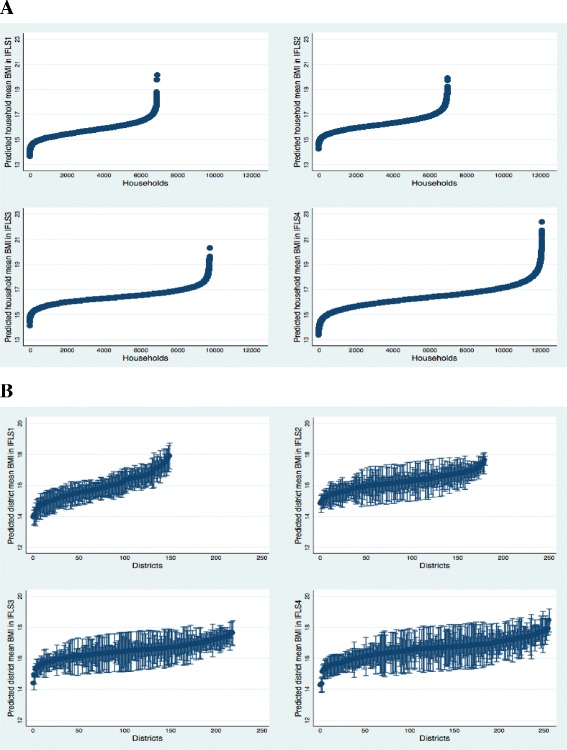
Fig. 2.

Distribution of BMI mean within and between a households and b neighborhoods. Indonesian Family life survey (IFLS) 1993–2007. Note. Dots represent the mean within-household and within-district BMI mean. Ninety-five percent bound around the means (based on the standard deviations of BMI mean); these values are excluded for households owing to the high number of households present in the data. Values are sorted from left to right by lowest household or district mean
