Fig. 6.

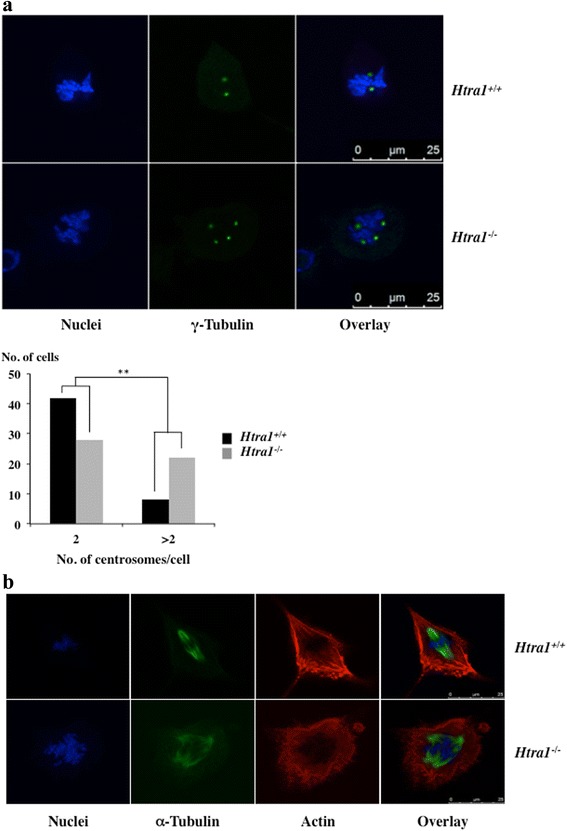
Disturbed spindle formation and centrosome abnormalities in HTRA1 depleted cells. a Representative images of Htra1 +/+ and Htra1 −/− MEFs. MEFs were grown on collagen coated glass slides, synchronised and analysed during mitosis by laser confocal microscopy. Centrosomes were visualised by anti-γ-tubulin antibody using an Alexa488 conjugated secondary antibody. Nuclei were counterstained with DAPI. Scale bar is 25 μm (upper panel). The number of centrosomes were counted in 50 Htra1 +/+ and Htra1 −/− MEFs, respectively (lower panel). For statistical analysis, data were classified into two sets (2 and >2 centrosomes per cell) and analysed via Fisher’s exact test (p-value = 0.0041). b Representative images of immunofluorescence staining with an α-tubulin antibody using an Alexa488 conjugated secondary antibody in primary Htra1 +/+ and Htra1 −/− MEFs (Passage 8). Nuclei were counterstained by DAPI. Scale bar is 25 μm
