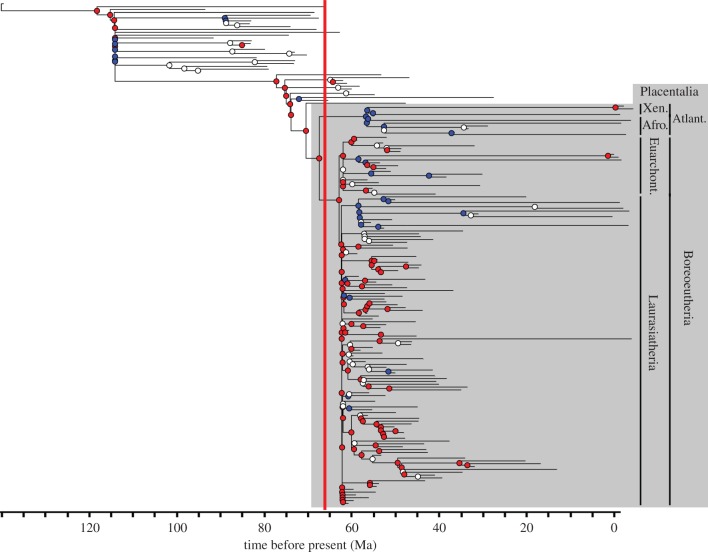
Figure 2.
Randomly selected exemplar time-scaled phylogeny with nodes coloured according to whether the clade for which they are the last common ancestor has significantly lower (blue) or higher (red) evolutionary rates than the remainder of the tree. The grey box indicates Placentalia, with the four placental superorders identified, while nodes and branches outwith the grey box are non-placental eutherians.

