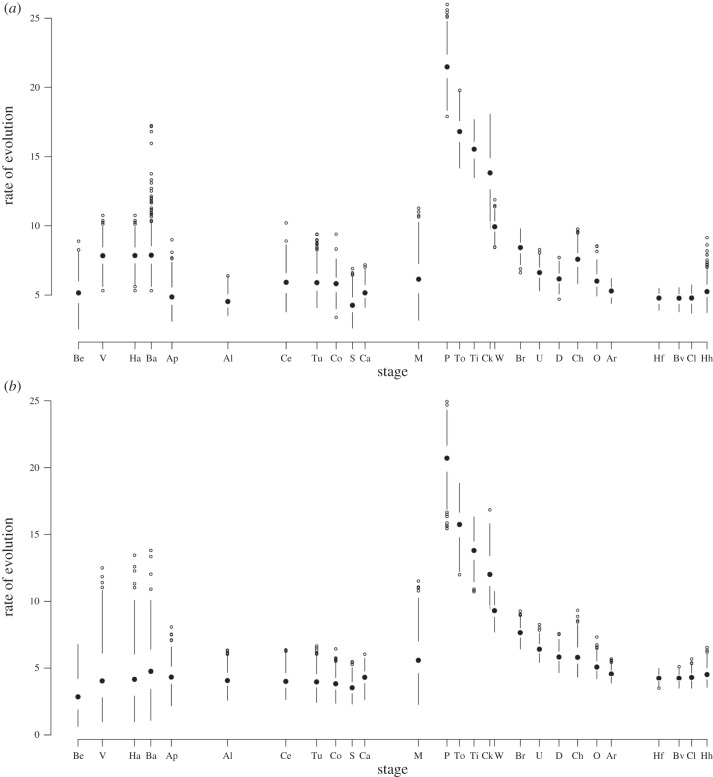
Figure 3.
Two graphs depicting evolutionary rate through time calculated from the consensus of optimal topologies only from the six different original phylogenetic analyses. The Cretaceous–Palaeogene boundary falls between the Maastrichtian (M) stage and the Puercan (P) North American Land Mammal Age. (a) A sampling rate of 85%, which implies that the fossil record is relatively good throughout the tree. (b) A conservatively poor rate of 0.5%. Both show low Cretaceous rates with a significant two- to fourfold increase at the end-Cretaceous mass extinction, although (b) shows greater variance.

