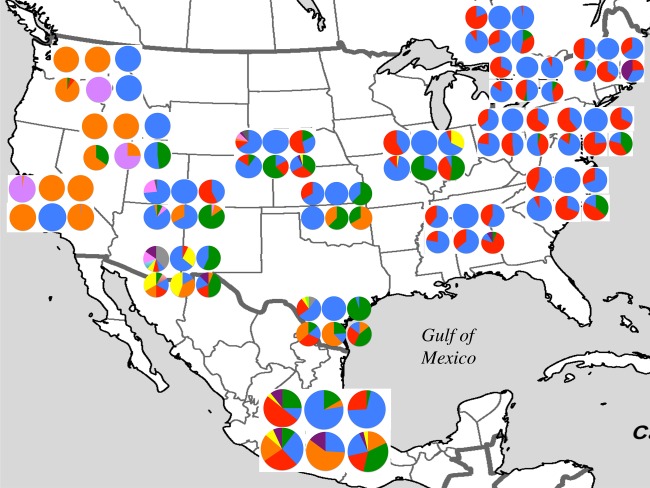
Figure 3.
Geographical distribution of allele frequencies for 17 populations of Peponapis pruinosa. Pie charts and colours represent microsatellite marker and allele frequencies, respectively. Populations from Arizona, Delaware, Iowa, Massachusetts, and Vermont, are not shown in the figure for clarity.

