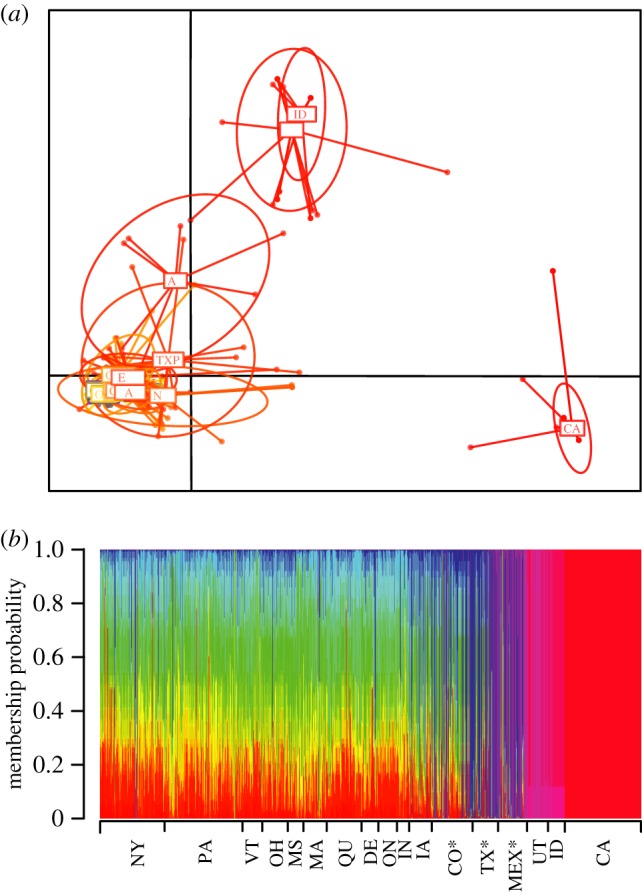
Figure 4.

Clustering analysis of individuals. (a) Scatterplot of the discriminant analysis of principal components (DAPC). Each ellipse represents a population that groups individuals based on the first principal component. (b) Membership probabilities based on DAPC. Vertical bars represent individuals coloured by sampling location. Partitioned vertical lines represent individuals with admixed membership.
