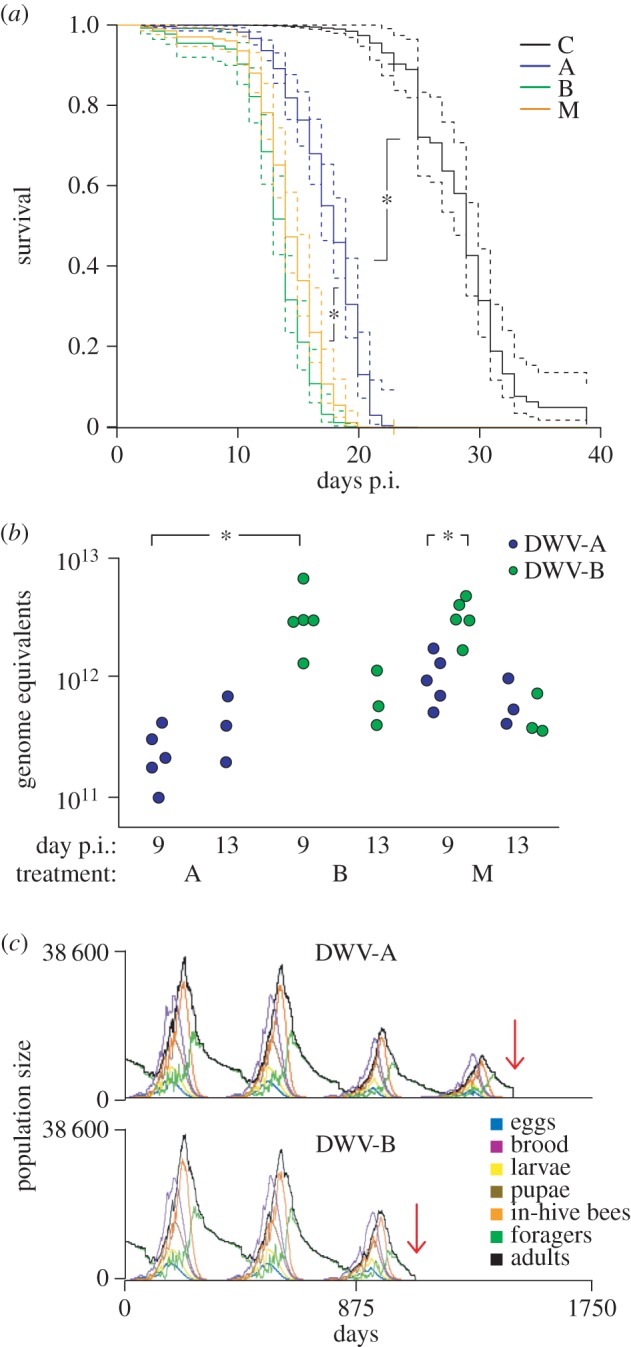
Figure 1.

Test of DWV virulence under controlled conditions. (a) Fitted Cox proportional hazard survival curves (solid coloured lines) in days post-infection (p.i.) following exposure by injection of V. destructor-free, newly emerged adults. C = control (black); A = DWV-A (blue); B = DWV-B (green); M = mix (orange) and 95% CIs for each fitted curve (dashed coloured lines). Star/lines show significant differences between treatments (p < 0.05) based on post hoc pairwise comparisons of the final model in table 1. Median survival of control bees was 29 days, for DWV-A injected bees it was 18 days, and for DWV-B injected bees it was 13.5 days. (b) DWV-A and -B titres in A, B and M treatments from bees extracted at 9 and 13 days p.i. (c) Population dynamics over time of colonies infected with DWV-A or -B. Models were run in BEEHAVE [45] with Mite-model parameters adjusted to reflect the relative individual mortality of adults and pupae infected with either DWV-A or -B. Individual daily mortality rates were derived from laboratory experiment survival data (panel (a); described in Methods). Colony collapse events are indicated by a vertical red arrow.
