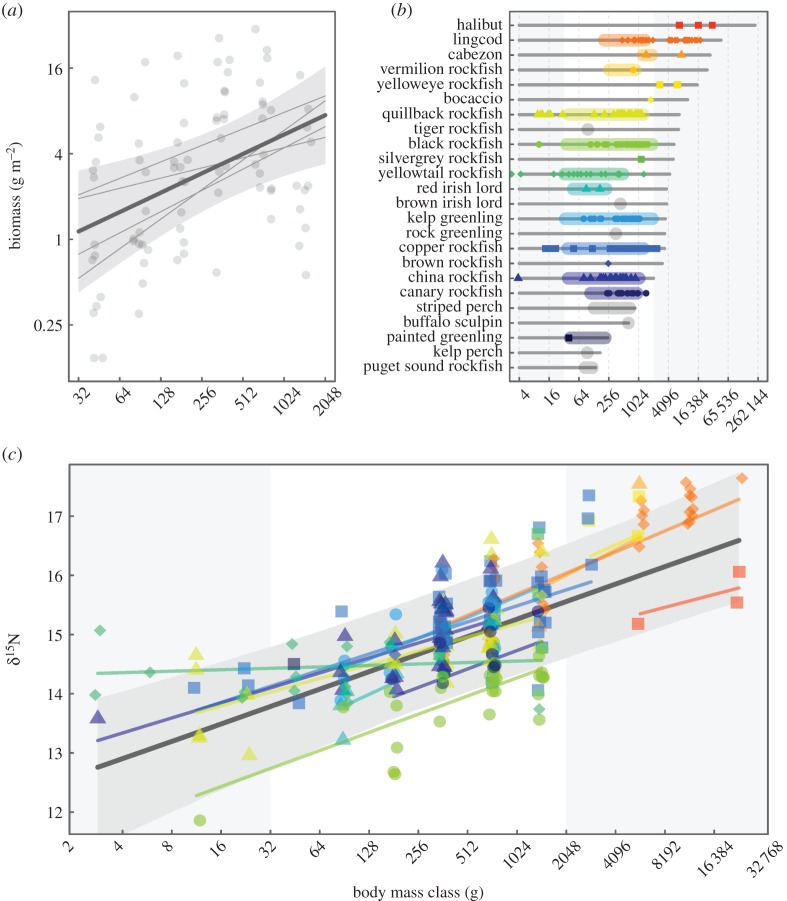
Figure 1.
(a) The biomass spectrum from visual surveys; (b) size ranges observed for individual species in visual surveys (coloured shaded regions) and sampled for isotope analysis (points) relative to lmax (from FishBase, grey bars); and (c) the relationship between δ15N, a proxy for trophic position, and body size for the kelp forest fish community of Haida Gwaii British Columbia, Canada. Dark grey lines in panels (a,c) represent the mean fit for each model (across locations for (a) and across both locations and species for (c)), and grey bands indicate 95% confidence intervals in (a) and 95% credible intervals in (c) about the mean fits. Light grey lines in (a) and coloured lines in (c) represent random effect fits for location and species, respectively. Colours/shapes of points are used to distinguish among species and are consistent between panels (b) and (c), with species that were observed on transects but not sampled for isotope analysis in grey in panel (b). Grey shaded regions in (b,c) indicate body sizes outside the range included in (a).

