
Figure 1.
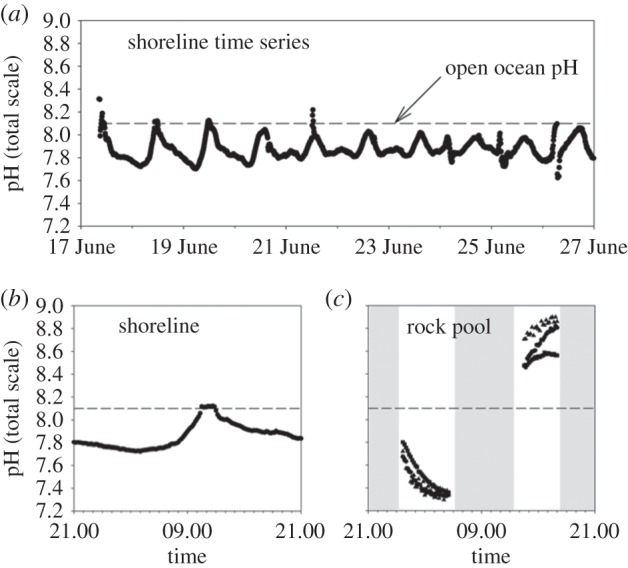
Representative records of pH in shoreline habitats and intertidal rock pools (total scale; [35]) within the Bodega Marine Reserve (BMR) during June 2014. (a) Time series of pH in shoreline waters that exchange freely with the surrounding ocean. Note the depression of pH values (solid line), owing to upwelling, relative to the present-day, global-average pH of open-ocean surface waters (dashed line; pH 8.1) [25]. (b) Example 24 h record of shoreline pH for which the daily low dropped to 7.7. As is apparent in (a), such regional deviations from global-average conditions occur routinely. (c) Example 24 h record of fluctuations in pH as amplified within rock pools that are chronically isolated from adjacent oceanic waters during low tides (immersed and emergent periods are shown with shading or no shading, respectively; various symbols depict data from different pools). Minima in pH arise owing to night-time accumulation of respiratory carbon within a confined water body, whereas pH maxima occur during daytime low tides owing to photosynthetic uptake of seawater carbon. Because of monthly and seasonal changes in the timing of low tides, such extreme negative and positive excursions in pH do not always follow one another but can occur independently (e.g. night-time low tides can happen without accompanying ones in the daytime, and vice versa). Note also that the depressed pH levels depicted here are not unusual; even lower values (e.g. down to 6.5 in pools in some systems [30]) have been recorded.