
Figure 3.
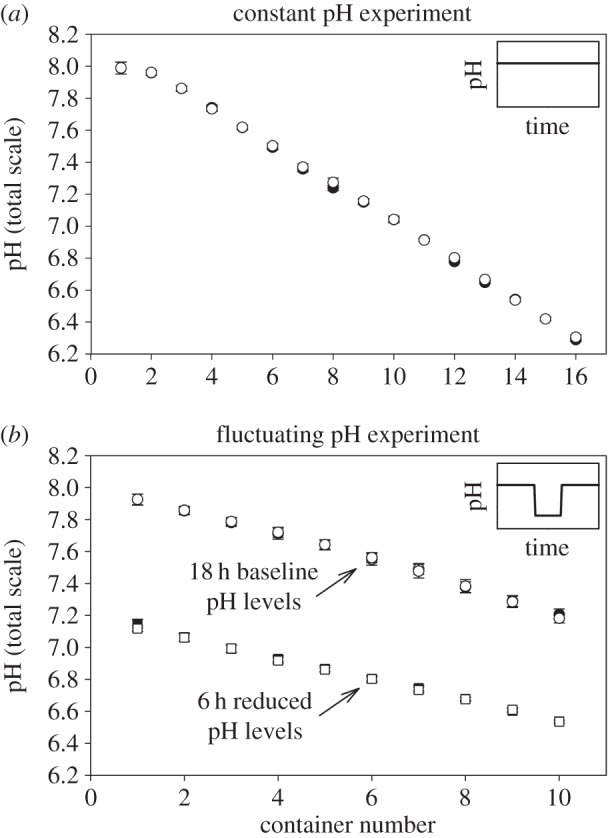
Values of pH (total scale; [35]) for each container averaged over the 5 day holding period for (a) experiment 1 (constant pH) and (b) experiment 2 (fluctuating pH). Insets indicate schematically the temporal character of the pH treatments over a single day. In experiment 2, pH values switched between 18 h at a baseline level (circles) and 6 h at a reduced level (squares), mimicking changes characteristic of rock pools during night-time low-tide series. Cue and no-cue treatments are indicated with solid shapes and empty shapes, respectively, and overlap sufficiently that many data points from a given pH level are obscured. Error bars depict standard error and in most cases are smaller than the symbols.