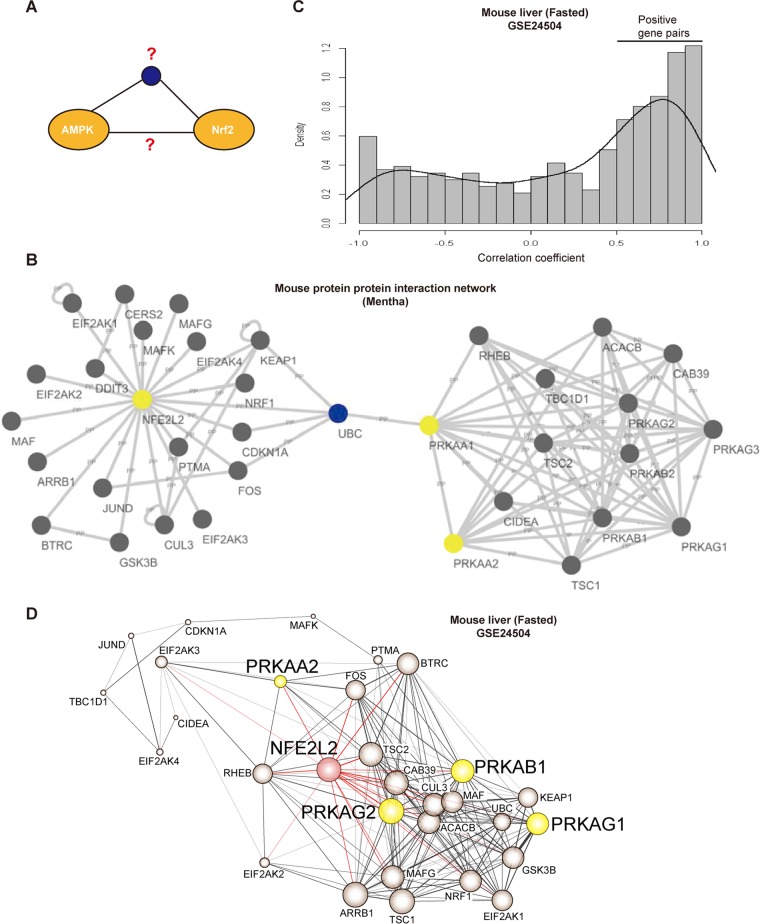
FIG 1.
The coexpression network between AMPK and Nrf2. (A) Schematic diagram of hypothesis. AMPK and Nrf2 may directly or indirectly interact with each other. (B) A subnetwork of protein-protein interactions between PRKAA1 (AMPKα1), PRKAA2 (AMPKα2), and NFE2L2 (Nrf2). (C) Density distribution of correlation coefficients between all gene pairs comprised in the subnetwork shown in panel B. Correlation coefficients were calculated using public cDNA microarray data (GEO database accession no. GSE24504). (D) Gene interaction network between AMPK and Nrf2. Gene interactions are based on the correlation profile. Filled colors indicate Nrf2 subunits (red) or AMPK subunits (yellow). The node size is proportional to the number of neighboring genes. The line thickness reflects the correlation coefficient between nodes.

