
FIG 10.
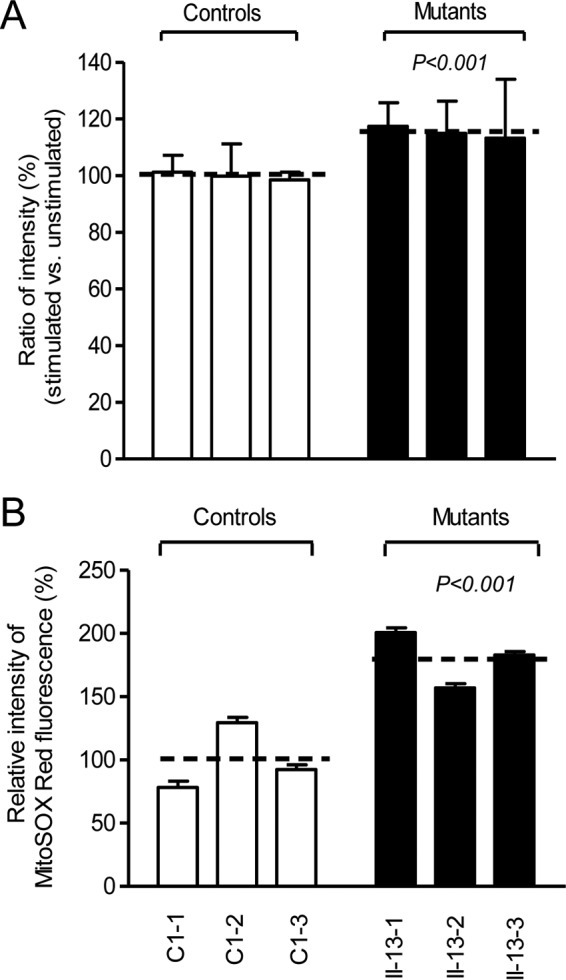
Measurement of cellular and mitochondrial ROS production. (A) Relative levels of ROS production in total cells. The rates of ROS production in total cells from three mutant cell lines and three control cell lines were analyzed by a BD-LSR II flow cytometer system with or without H2O2 stimulation. The relative ratio of intensity (H2O2-stimulated versus unstimulated cells) was calculated. (B) Relative levels of ROS production in mitochondria. The levels of ROS generation by mitochondria in living cells from three mutant cell lines and three control cell lines were determined using the mitochondrial superoxide indicator MitoSOX-Red. Fluorescence was measured using a FACSCalibur instrument (BD Biosciences), with excitation at 488 nm and emission at 580 nm. The data were analyzed with FlowJo software. The average of three determinations for each cell line is shown. Graph details and symbols are explained in the legend to Fig. 3.