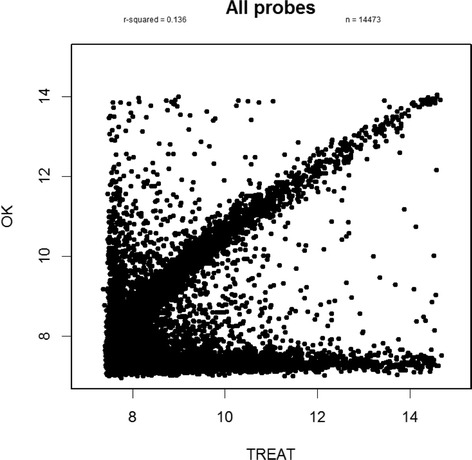
Fig. 1.

Correlation between gene expression of probes between Oklahama (OK) and TREAT data. Four observations are shown; first, at x = y, probes correlate well; second, with y < 8, probes with low expression in the Oklahoma data but a range of expression in the TREAT data; third, when x < 8, probes with low expression in the TREAT data but a range of expression in the Oklahoma data; and, lastly, random scatters of probes in between Oklahoma and TREAT data
