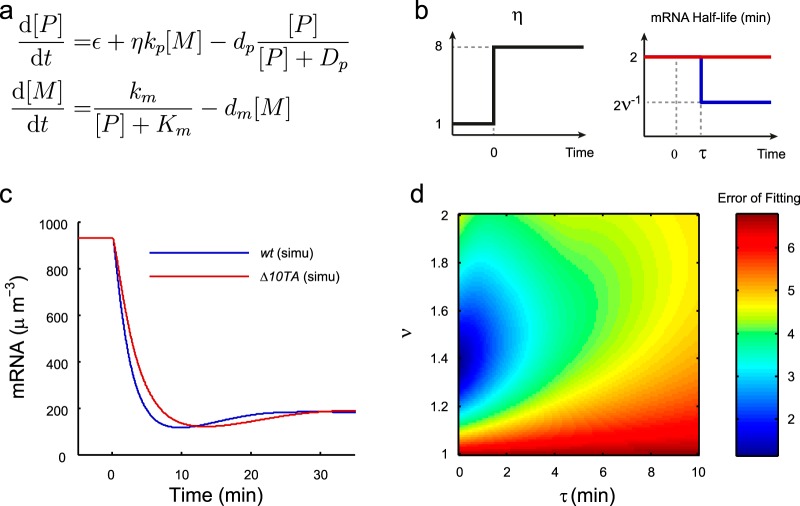
FIG 3.
Model of the early stringent response. (a) Formulation of the model. (b) (Left) Illustration of the relative RelA activity (η) upon isoleucine starvation at time zero. (Right) Illustration of the average mRNA half-life (ln2/dm) upon isoleucine starvation at time zero for both the wt strain (blue) and the Δ10TA strain (red). (c) Simulated concentrations of mRNA for the wt and Δ10TA strains (see Fig. 1a). (d) Effects of the time scale (τ) and strength (ν) of mRNA cleavage activity by toxins on the error of fitting to the wt measurements.

