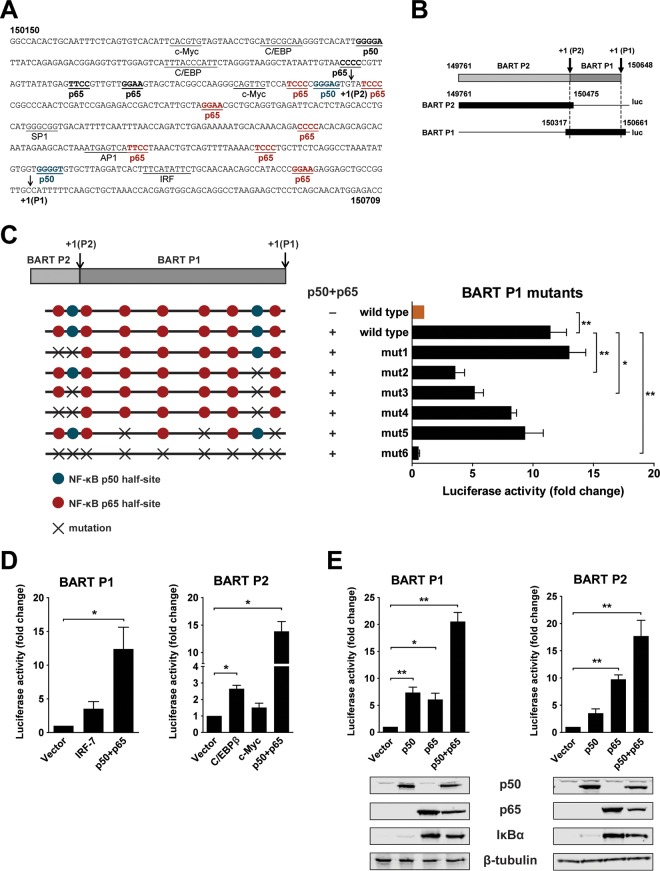
FIG 1.
NF-κB activates EBV BART promoters. (A) Sequence of the BART promoter region showing the locations of previously identified transcription factor binding sites (underlined), putative NF-κB binding sites (bold and underlined, with p65 and p50 sites within the region included in the BART P1 reporter shown in red and blue, respectively), and P1 and P2 RNA initiation sites (arrows). The nucleotide coordinates, 150150 to 150709, are based on the EBV B95-8 genome. (B) Illustration of P1 and P2 reporter constructs (solid black). (C) Location of mutations introduced into the P1 reporter at putative NF-κB p50 (blue) and p65 (red) half-sites. HEK 293T cells were cotransfected with p50 and p65 expression vectors together with the BART P1 promoter reporter with and without mutations. Relative luciferase activity is expressed as the fold change compared to the level of wild-type reporter activity, which was set to 1. (D) HEK 293T cells were cotransfected with empty vector or expression vectors for either p50 and p65, IRF-7, C/EBPβ, or c-Myc, together with either the BART P1 or P2 promoter reporter, as indicated. Relative reporter activity was estimated and expressed as the fold change compared to the vector control. (E) HEK 293T cells were transfected with either p50, p65, or p50 and p65 expression vectors together or with a control empty vector, together with the BART P1 or P2 promoter reporter. Relative reporter activity was estimated and expressed as the fold change over that of the vector control. The expression of p50, p65, IκBα, and β-tubulin was confirmed by immunoblotting using specific antibodies. Relative luciferase activities are expressed as the fold change in luciferase activity, calculated by normalizing firefly/Renilla ratios to those of the vector control. Experiments were performed in triplicate, and the results presented are the averages and standard errors of the means from three independent experiments. P values were calculated using a two-tailed Student's t test (*, P < 0.05; **, P < 0.01).

