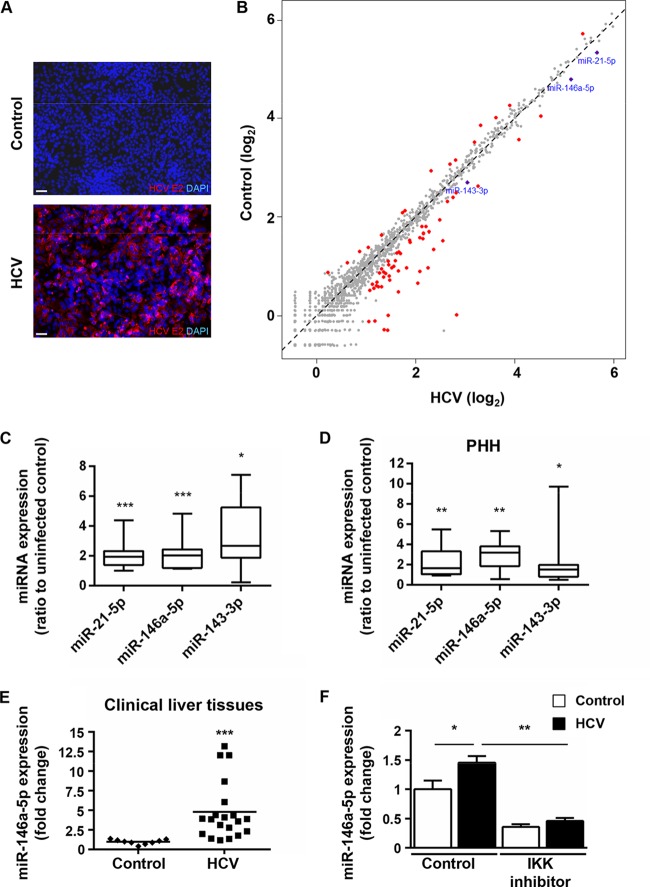
FIG 1.
Persistent HCV infection modulates host cell miRNA expression in hepatocyte-like Huh7.5.1 cells. (A and B) Huh7.5.1 cells were differentiated into hepatocyte-like cells by use of 1% DMSO (14–16), persistently infected using HCVcc, and subjected to molecular analyses at 7 dpi. (A) Immunodetection of HCV E2 protein in HCV Jc1-infected hepatocyte-like cells (HCV) and noninfected controls. Nuclei were counterstained with DAPI. Representative overlay images are shown. Bars, 50 μm. (B) Modulation of miRNA expression by HCV infection. Small RNAs (19 to 24 nt) from HCV Jc1E2FLAG-infected cells (HCV) or noninfected controls were subjected to RNA-Seq (see Materials and Methods). The scatterplot shows the 72 miRNAs with significant modulation upon HCV infection compared to control cells (red dots). miR-21-5p, miR-146a-5p, and miR-143-3p, which were enriched in HCV-infected cells, are highlighted in blue. (C) HCV increases the expression of miR-21-5p, miR-146a-5p, and miR-143-3p in hepatocyte-like cells. miRNA expression was analyzed by RT-qPCR assays of total RNA extracts from HCV-infected cells compared to noninfected controls. Results are for three independent experiments. (D) HCV increases the expression of miR-21-5p, miR-146a-5p, and miR-143-3p in PHH. miRNA expression was analyzed by RT-qPCR assay of total RNA extracts from HCV Jc1-infected PHH at 3 dpi compared to noninfected controls. Results are for five independent experiments. In panels C and D, the plots show sample lower quartiles (25th percentile; bottom of the box), medians (50th percentile; horizontal line in box), and upper quartiles (75th percentile; top of the box). The bottom and top whiskers indicate the 2.5 and 97.5 percentiles, respectively. (E) miR-146a-5p expression is enhanced in liver tissues from HCV-infected patients. Liver tissues from 20 HCV-infected patients (HCV) and 9 noninfected subjects (control) were analyzed for miR-146a-5p expression by RT-qPCR. Results for different biopsy specimens are shown as individual points. Median miRNA expression is shown as a black horizontal line. (F) HCV-induced upregulation of miR-146a-5p is mediated by NF-κB in hepatocyte-like cells. Cells were pretreated with the IKK inhibitor ACHP (6.25 μM) for 24 h and subjected or not subjected to HCV infection for 5 days. Nontreated cells (control) were analyzed in parallel. miR-146a-5p expression was assessed by RT-qPCR. The plots show mean fold changes ± standard errors of the means (SEM) for 4 independent experiments. In panels C, D, and E, statistical significance is indicated as follows: *, P < 0.05; **, P < 0.01; and ***, P < 0.0001 (two-tailed Mann-Whitney test). In panel F, statistical significance is indicated as follows: *, P < 0.01; and **, P < 0.001 (one-way ANOVA).

