FIG 2.
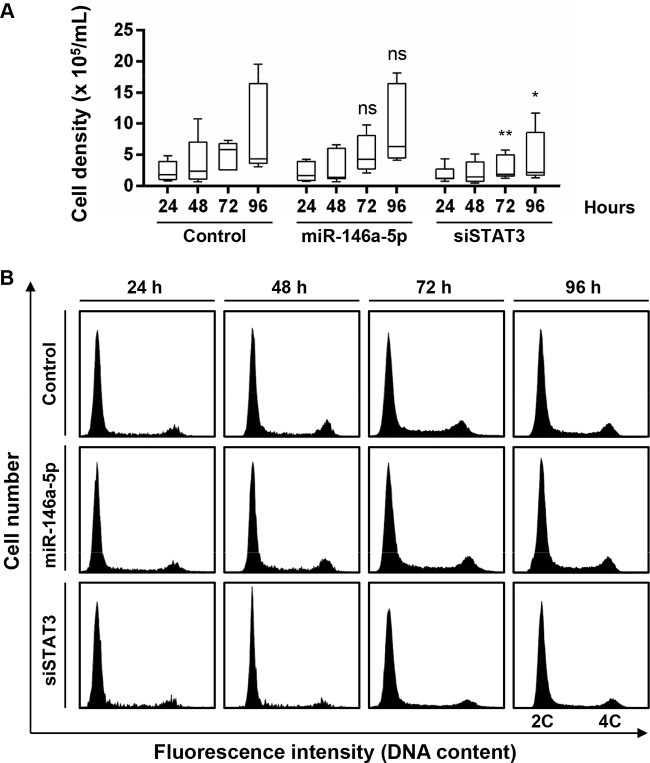
Overexpression of miR-146a-5p does not alter proliferation and cell cycle distribution in hepatocyte-like cells. Differentiated Huh7.5.1 cells were transfected with control siRNA, a miR-146a-5p mimic, or siSTAT3. (A) Cell proliferation was assessed 24, 48, 72, and 96 h after transfection by direct cell counting. The plots show sample lower quartiles (25th percentile; bottom of the box), medians (50th percentile; horizontal line in box), and upper quartiles (75th percentile; top of the box). The bottom and top whiskers indicate the 2.5 and 97.5 percentiles, respectively. Results are for three independent experiments. *, P < 0.05; **, P < 0.01; ns, not significant (Kruskal-Wallis H test). (B) Cell cycle distribution was assessed at the different time points by flow cytometry following propidium iodide staining. Representative cell cycle profiles from one of three independent experiments are shown. 2C, cells in G0/G1 phase, with diploid DNA content; 4C, cells in G2/M phase, with tetraploid DNA content. The population of miR-146a-5p-overexpressing cells displayed a profile comparable to that of control cells. In contrast, the numbers of cells in the S and G2/M phases were markedly decreased upon knockdown of STAT3 compared with controls.

