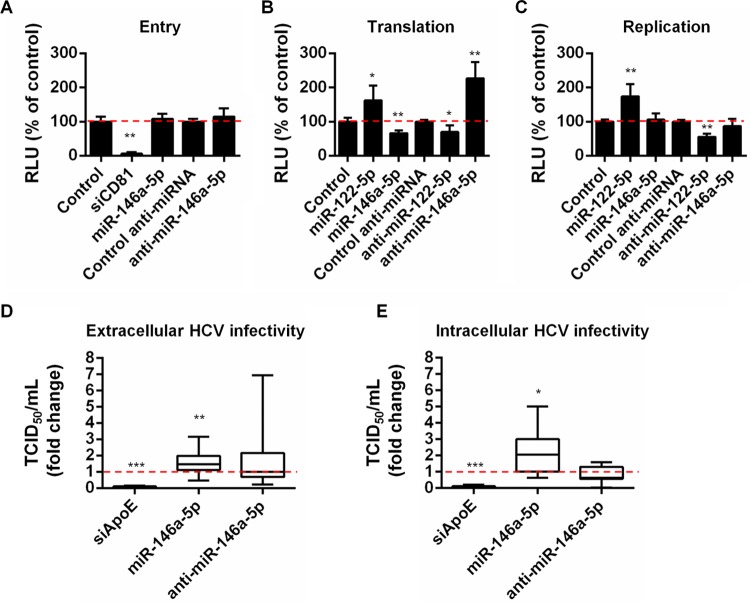
FIG 5.
miR-146a-5p promotes HCV infection by enhancing production of infectious viral particles. (A) miR-146a-5p does not affect HCV entry. Huh7.5.1 cells were transfected with the indicated compounds and incubated with HCVpp for 72 h. HCVpp entry was assessed by determining the intracellular luciferase activity, which was expressed in relative light units (RLU). Results represent mean percentages ± SD for three independent experiments. (B) miR-146a-5p decreases HCV RNA translation. Huh7.5.1 cells were transfected with the indicated compounds and then, 48 h later, transfected with HCV RNA (JcR2a). HCV translation was assessed by determination of the luciferase activity 4 h later. Results are shown as mean percentages ± SD for three independent experiments. (C) miR-146a-5p does not modulate HCV replication. Huh7.5.1 cells were electroporated with assembly-deficient JFH1/ΔE1E2 RNA 48 h prior to transfection with the indicated compounds. HCV replication was assessed by determination of the luciferase activity 48 h later. Results are shown as mean percentages ± SD for four independent experiments. In panels A, B, and C, the dashed lines indicate an RLU level of 100% of the control level. (D and E) miR-146a promotes HCV assembly and egress. Huh7.5.1 cells were transfected with the indicated compounds 48 h prior to infection with HCVcc (Jc1). After 4 h, the viral inoculum was removed and cells were incubated with fresh medium for 48 h. Cells were lysed to determine the intracellular HCV RNA load and infectivity (TCID50/ml). Likewise, supernatants were used to determine the extracellular HCV RNA load and infectivity. The results represent extracellular (D) and intracellular (E) HCV infectivities as fold changes compared to control-transfected cells and are for nine independent experiments. The plots show sample lower quartiles (25th percentile; bottom of the box), medians (50th percentile; horizontal line in box), and upper quartiles (75th percentile; top of the box). The bottom and top whiskers indicate the 2.5 and 97.5 percentiles, respectively. The dashed lines indicate a fold change of 1. In panels A, B, and C, statistical significance is indicated as follows: *, P < 0.001; and **, P < 0.0001 (unpaired t test with Welch's correction). In panels D and E, statistical significance is indicated as follows: *, P < 0.05; **, P < 0.01; and ***, P < 0.0001 (two-tailed Mann-Whitney test).

