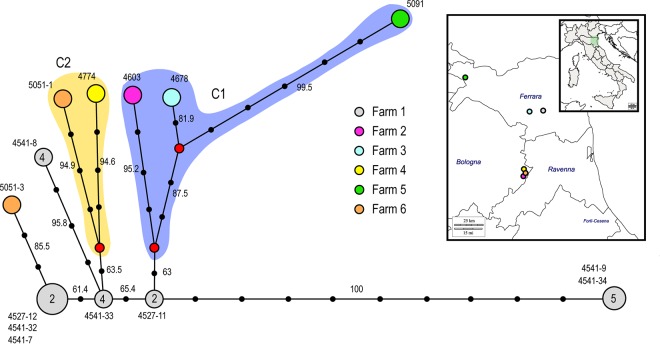
FIG 6.
Median-joining phylogenetic network. (A) The network was constructed from the consensus sequences of the eight concatenated gene segments. Each unique sequence genotype is represented by a circle sized relatively to its frequency in the data set. Numbers next to the circles correspond to the samples showing that particular genotype, while the number within the circle represents the shed where the genotype was identified. Genotypes are colored according to farm. Branches represent the shortest trees, and black circles represent the numbers of nucleotide mutations that separate each node. Median vectors are indicated as red circles. The violet and yellow shading represent the two identified genetic groups C1 and C2. The numbers at each branch represent bootstrap values. (B) Map showing the geographic locations of the six infected farms.

