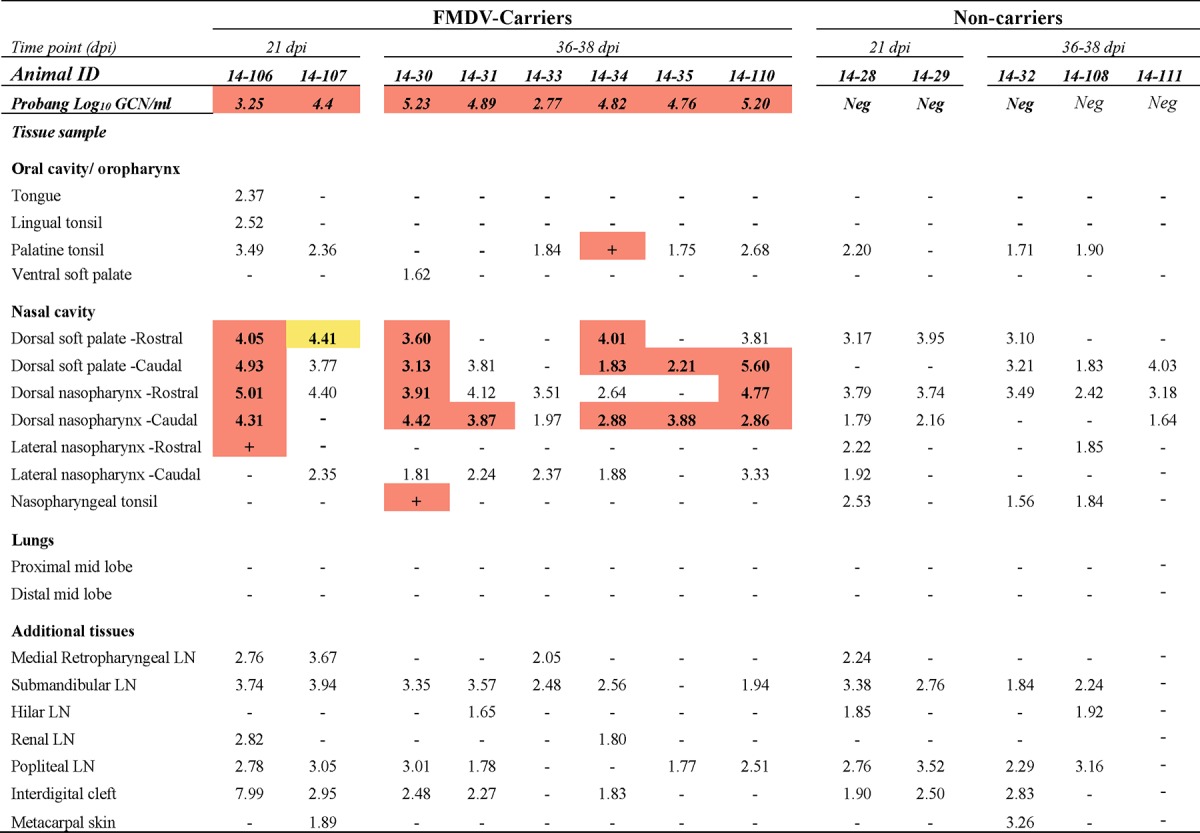
TABLE 2.
Tissue distribution of FMDV RNA and infectious virus during persistent phase of infection in nonvaccinated cattlea

The numbers in the table represent the log10 genome copy number (GCN) per milligram of FMDV RNA in tissue or the log10 GCN per milliliter of oropharyngeal fluid (probang samples). Bold numbers in cells with orange shading, samples were positive for both FMDV RNA (by qRT-PCR) and virus isolation; + in cells with orange shading, virus isolation was positive but the FMDV RNA content was below the limit of detection; −, double-negative samples; bold numbers in cells with yellow shading, samples were virus isolation positive following TTE treatment of tissue macerates; ID, identifier; Neg, negative; LN, lymph node. The limits of detection were 1.53 log10 FMDV GCN/mg of tissue and 1.57 log10 FMDV GCN/ml OPF.
