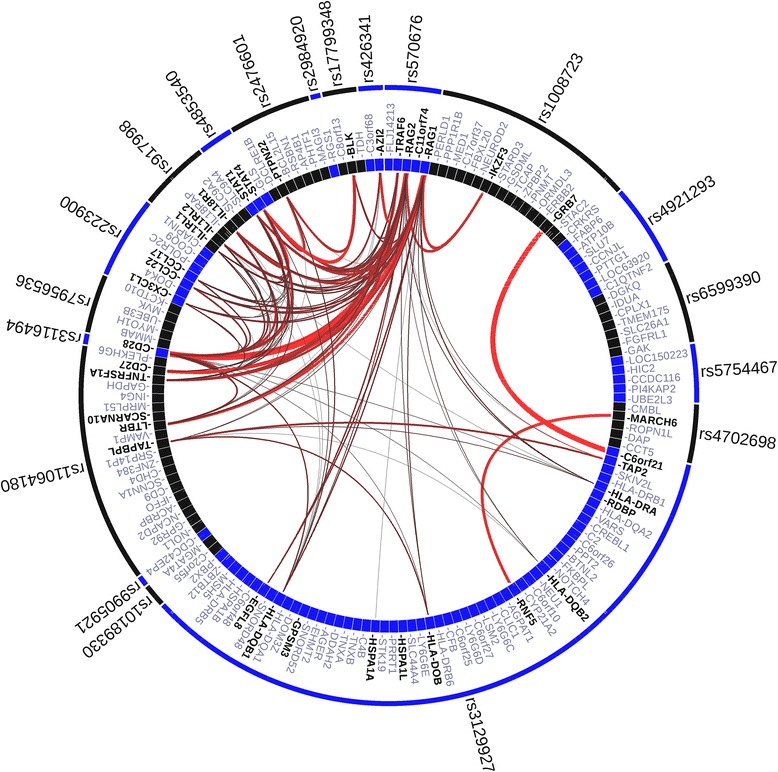
Fig. 3.

Visualising Gene Relationships Across Implicated Loci (VIZ-GRAIL) plot of 19 associated single nucleotide polymorphism (SNP) loci. Outer circle labelled with SNPs, inner circle with candidate genes. Thickness and brightness of lines represents the strength of the connections between genes, VIZ-GRAIL (Visualising GRAIL connections)
