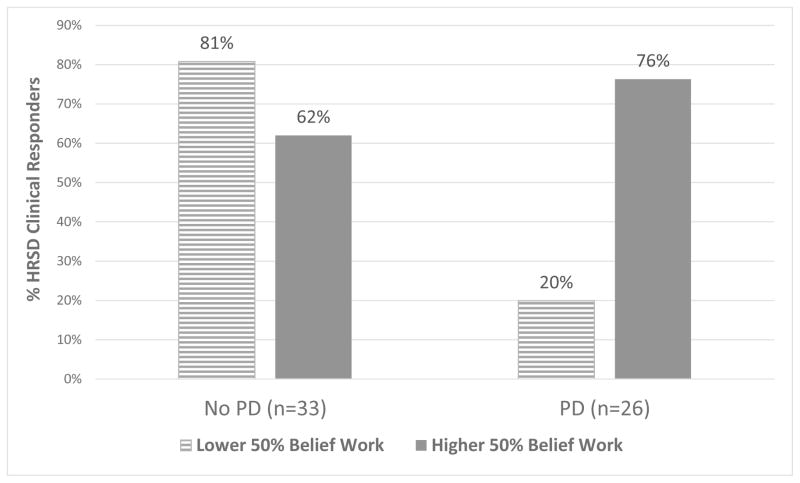
Figure 2.
Clinical response (percentages estimated by the model’s output) as a function of personality disorder co-morbidity and receiving CT-Belief techniques at session 3 in the lower 50% versus higher 50% of the CT-Belief distribution for the total sample. For these estimates, modelled variables that were not directly represented (prior change, BDI at session of measurement, CT-Concrete techniques) were set to the respective means for No PD and PD patients.

