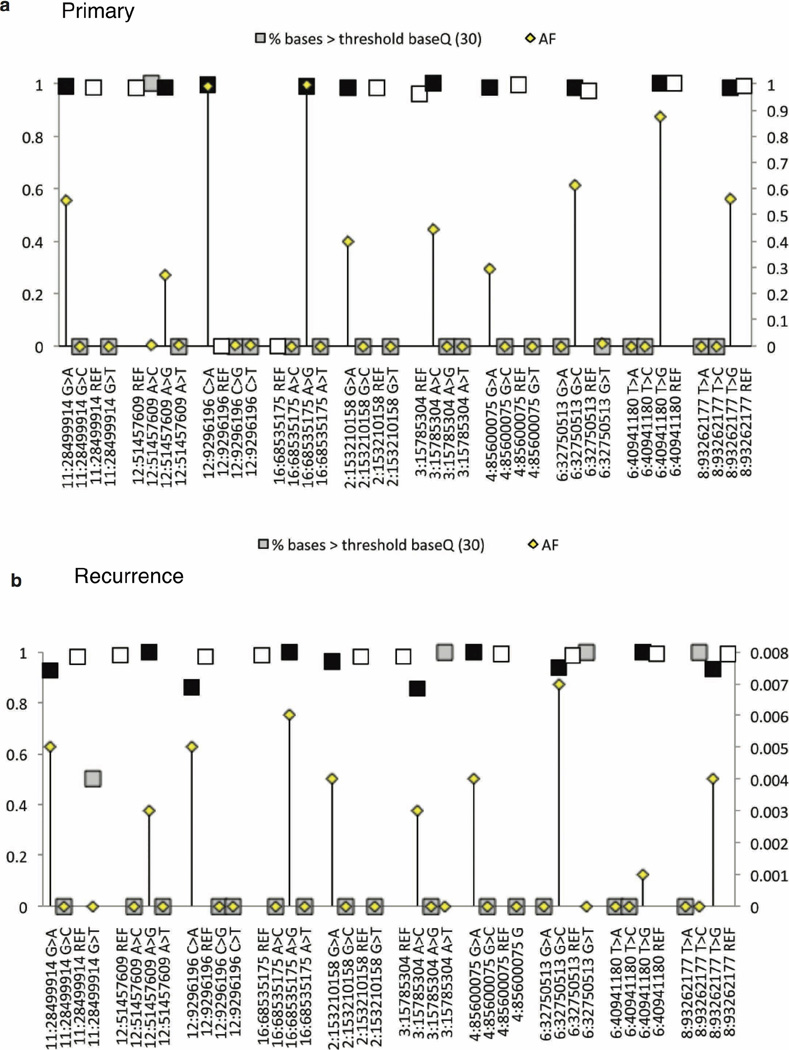
Extended Data Figure 8. Base quality assessment of reference and alternate alleles at SNVs with clonal or rare allelic frequencies.
a, b, To determine whether low-frequency (<5%) base calls were SNVs or sequencing errors, we analysed the distribution of base quality (baseQ) values for each alternate base called. This plot shows the allele frequencies (AF; secondary y axis) and the proportion of supporting reads with baseQ values >30 (primary y axis) for a subset of SNVs in the recurrent tumour of MB-REC-03 (x axis). At all positions, and in both the recurrent (a), and primary (b), tumours, we observe a high proportion (~100%) of reads with baseQ >30 at both the mutant (black square) and wild-type allele (white squares). Grey squares indicate alleles categorized as sequencing errors. Errors have low allelic frequencies (in many cases are just one read) and a much smaller proportion of reads with baseQ values >30. In the primary tumour, the baseQ and AF values match the pattern observed in the recurrent tumour, indicating that these calls represent true SNVs present at very low frequencies. Sequencing errors in the primary sample have the same base distribution as sequencing errors in the recurrent tumour sample.

