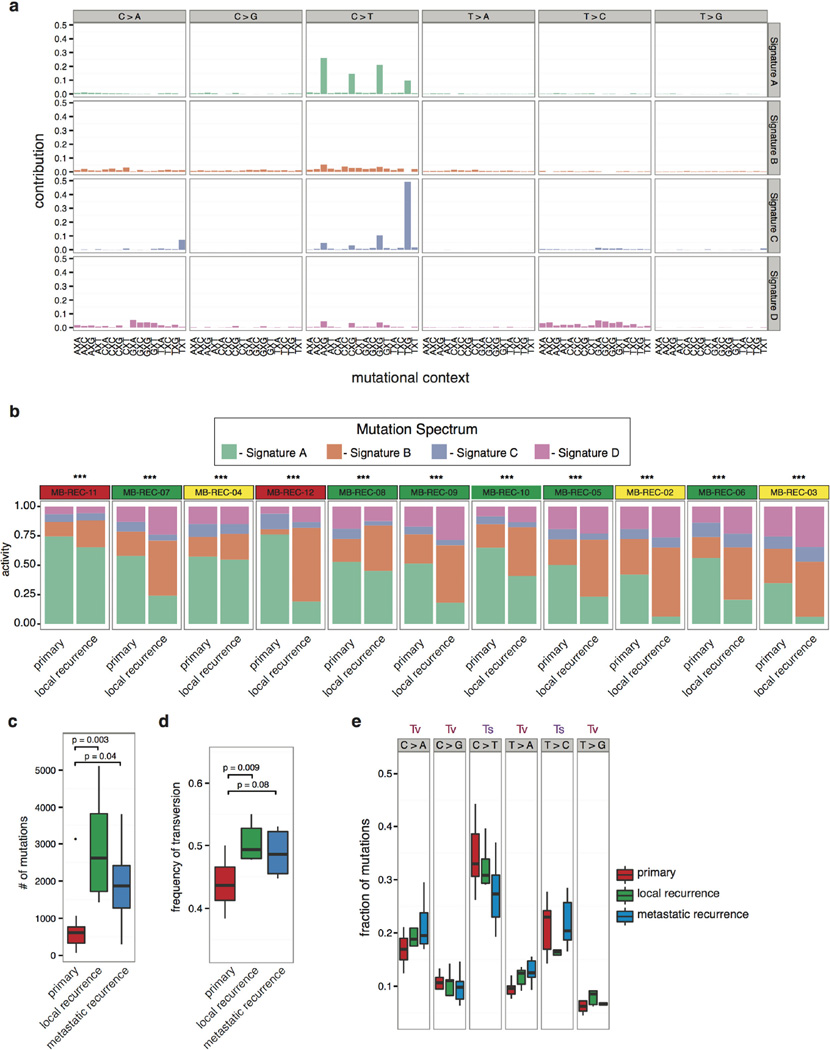
Extended Data Figure 4. Altered spectra of somatic SNVs when comparing therapy-naive to recurrent tumours.
a, Mutations in each tumour sample (n = 15) were classified based on their sequence context, and clustered into signatures that represent four known mutational processes. Signature A is the age-related signature observed in most tumour types (deamination of methyl-C). Signature B is characterized by C > A and C > T mutations without a strict context requirement. Signatures C and D respectively resemble the MSI-L and MSI-H signatures that correlate with low (MSI-L) or high (MSI-H) microsatellite instability. b, The contribution of each mutational process to each primary and recurrent tumour is summarized by patient. Recurrent tumours show a shift away from signature A, and an increased prevalence of signature B and signature D. *** P < 0.001, chi-squared test denotes significantly different distributions; NS denotes not significant. All tumours shifted mutational signatures at the time of recurrence, for a and b, n = 15. c, d, The number c, and frequency d, of transversion mutations is summarized in therapy-naive and recurrent samples. Significant increases in the number and frequency of transversions is most strongly observed in local recurrences, and to a lesser extent in metastatic recurrences. P < 0.05, Wilcoxon rank-sum test. e, Breakdown of transversion (Tv) and transition (Ts) mutations in therapy-naive and recurrent samples does not show a significant trend in specific nucleotide changes. Centre lines show the medians; box limits indicate the 25th and 75th percentiles; whiskers extend up to 1.5 times the interquartile range (from the 25th to the 75th percentiles), and data points beyond the whiskers are outliers represented by dots. For c, d and e, n = 13, n = 7 and n = 6, respectively.

