
Fig. 1.
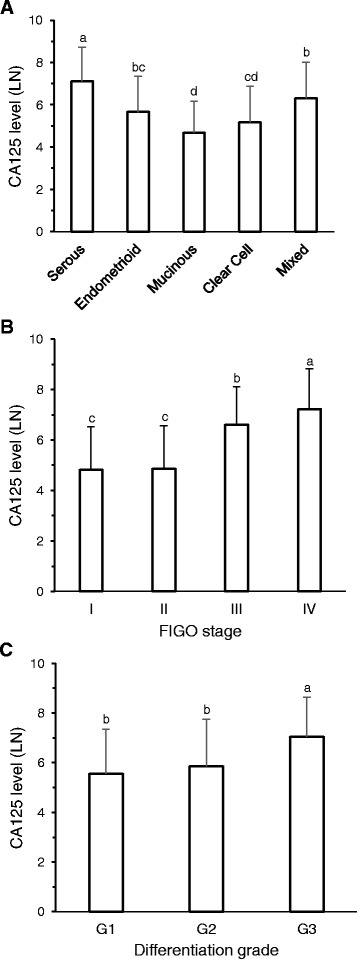
Absolute values of pretreatment CA125 normalized to natural logarithms (LN). a Classified by histological subtypes. b Grouped according to FIGO stage. c Separated by degree of differentiation. Bars represent: Mean ± SD, n = as indicated in Table 1. Bars with different superscript indicate P < 0.05