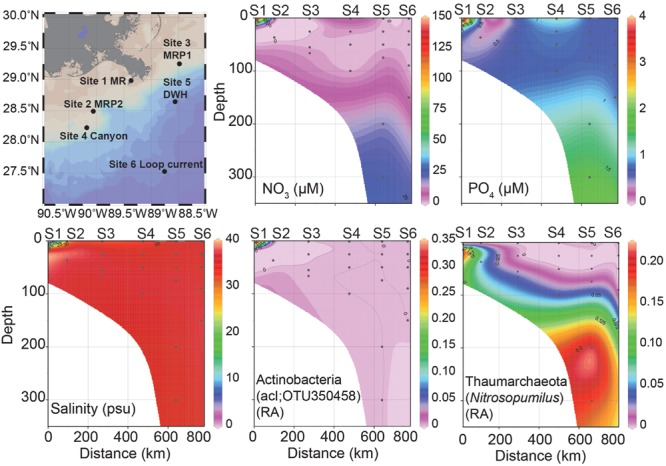
FIGURE 1.

Station map of six sites sampled, nutrient concentrations (NO3-, PO43-), salinity (practical salinity units, psu) and relative abundances (RA) of Actinobacteria; acI and Thaumarchaeota; Nitrosopumilus profiles over depth. In all figures distance is zero at the MR site and then proceeds: MRP2, MRP1, canyon, DWH to the loop current site at 800 km. These sites are plotted along a surface sample salinity trajectory from lowest (MR) to highest (LC). The sites are: Site 1 MR (S1), Site 2 MRP2 (S2), Site 3 MRP1 (S3), Site 4 canyon (S4), Site 5 DWH (S5), and Site 6 loop current (S6).
