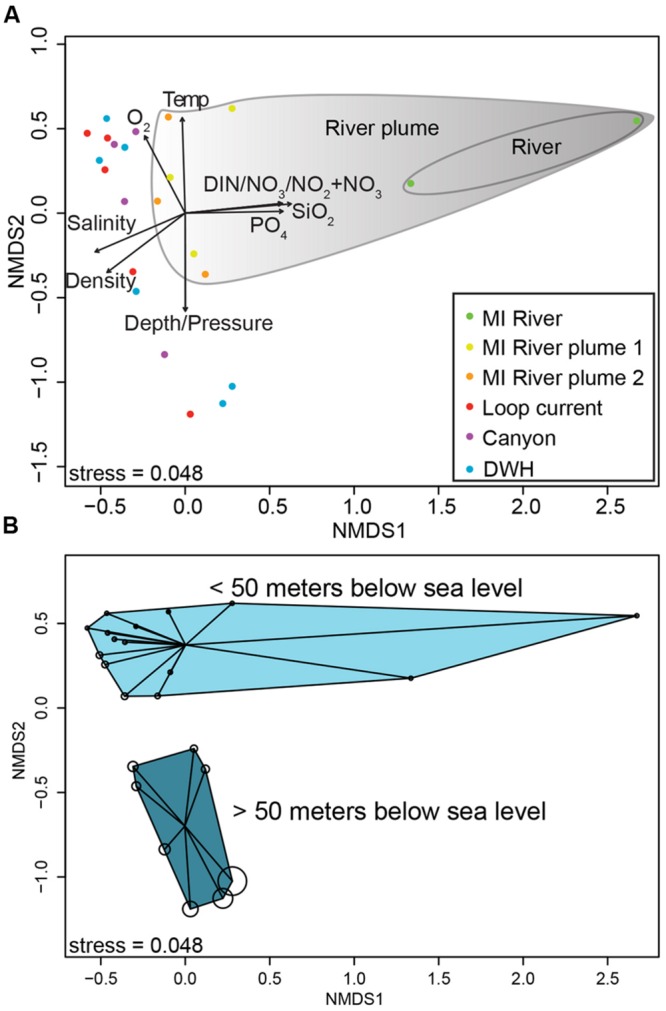
FIGURE 2.

Non-metric multidimensional scaling ordination plot of normalized 16S rRNA gene sequence data (A,B). (A) Biplot showing correlations between environmental variables and ordination axes. (B) The same ordination, but shows depth by bubble size, which increases with increasing depth. (B) Shows sample clustering by depth (<50 m and >50 m).
