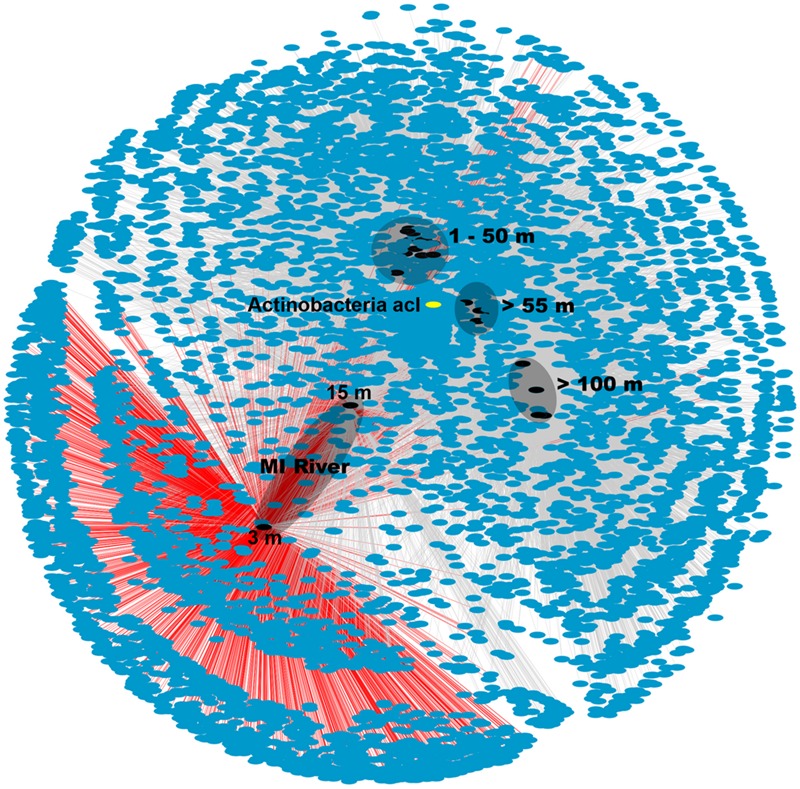
FIGURE 3.

Network analysis of OTU data from 16S rRNA gene sequences. Sample nodes are black, OTU (7,111) nodes are blue and edges are gray. OTUs from MR-P1_3 m are connected via red edges. The different depths are indicated on the figure. The depths of the two MR samples are shown in the figure. The actinobacterial, acI OTU that was particularly prevalent in the shallow MR sample, node is shown in yellow.
